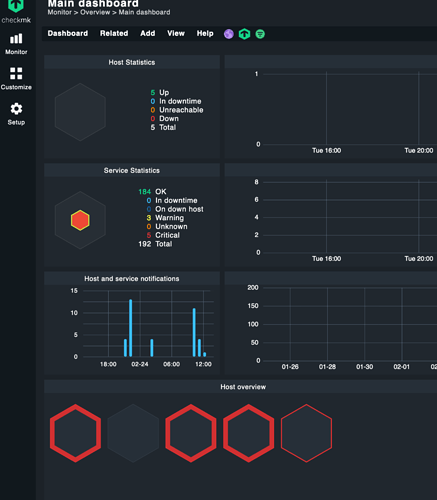
The default dashboard landing page in my new installation of 2.0.0b8 has these hexagonal graphics that are supposed to contain useful information, but they have been blank since install and several days later haven’t populated, except one. I tried flipping from dark to light themes.
Anyone seen/solved this?
Hi,
do you mean the “Host Statistics” and “Service Statistics”? If yes: Theses graphics are not filled, if all hosts are up or all services are ok. In your screenshot, all 5 hosts are up, so the graphic is empty.
Karl
Maybe someone from the checkmk team can chime in here for an explanation of the empty beehive graphics, @fayepal ?
OK, thanks for the clarification. I will offer my opinion for whatever it is worth to whomever might be listening that these latest graphics are potentially confusing. While I welcome a change from the balls and globes of years past, I think that a polygon that clearly has room for information inside but is entirely blank looks more like a rendering problem than an all-OK state. Also, the empty hexagons that each represent a host but I have to mouseover to see which hostname pops up. That said, I am in heaven with the improvements of v2.0.0.
This topic was automatically closed 365 days after the last reply. New replies are no longer allowed. Contact @fayepal if you think this should be re-opened.
