Dashboard or Report - Number of incidents (Critical) for a service over the last month

Hello

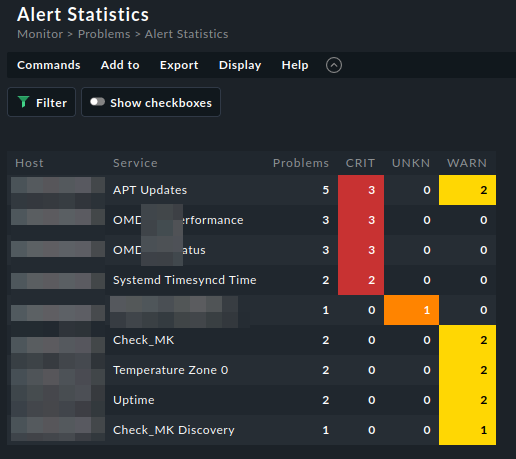
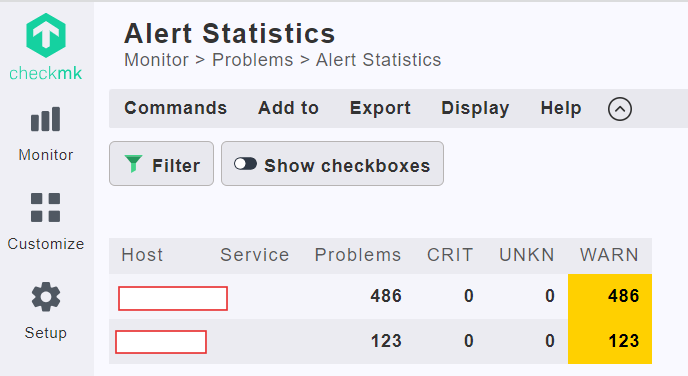
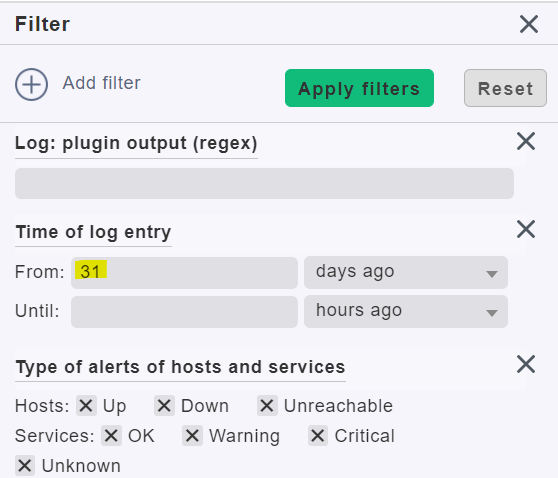
I need a dashboard or report which shows me the number of state changes to critical for specific services over the last month and it would be nice to configure a threshold.

For example:
Show all services of (CPU, Memory) where I have more then 15 critical incidents over the past month.

The result should be:
System x had 23 critical incidents in the last month for the service z
System y had 18 critical incidents in the last month for the service z

Is it possible to create such a dashboard or report?

Thanks

Have you seen the Alert Statistics view? (Monitor → Alert Statistics)

image

It’s not exactly what you ask for but it comes quite close.

What it can’t do is filter for “at least 15 incidents”. But you can sort by the number of incidents

Hi @JoJo,

Please navigate to VIEWS >> Problems >> Alert Statistics. It will show Alerts triggered for respective parameter. You can modify time period default is 31 days. You also filter type of alerts.

image

image

Regards,
DD

1 Like