Hey,
i’ve some hosts and services which are 24x7 in downtime to cause no alerts and dont fill up the service problems. But they are needed for reporting cases (printers for example).
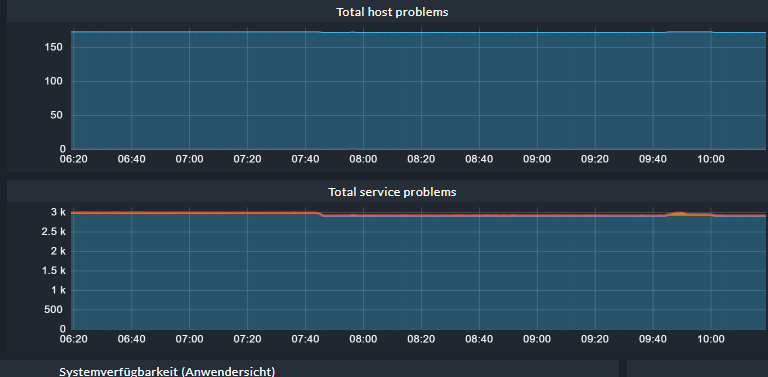
That leads to the built-in Total host problem and Total service problems graphs are not very useful, because they are so many services in downtime.
Is there a way to exclude them? I thought about a custom graph or sth. like this, but I dont know where to get this data from, cause it seems to come from a internal check.
Hey, the filter is an good idea, but for us the filter does not work for the Graphs “Total host problems” and “Total service problems”.
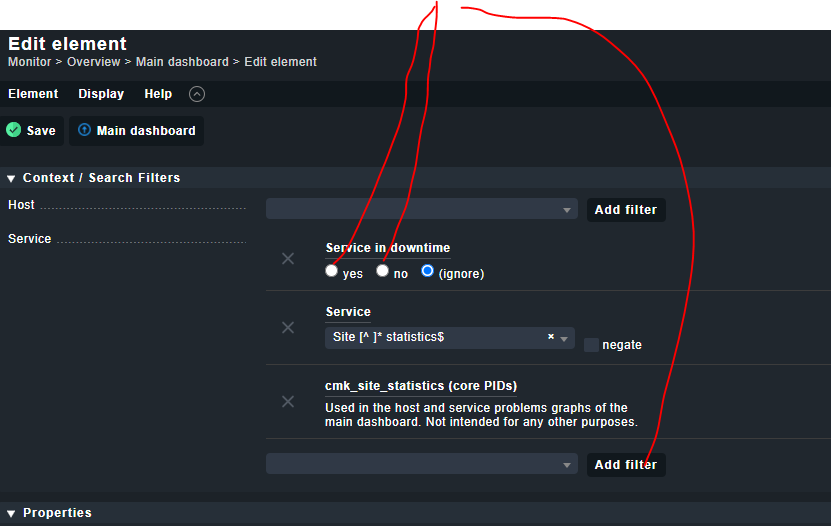
As you can see i’ve added a filter on a graph level to exclude downtimes - this does not work.
If we set a filter on Dashboard level that works for Host problems, and Host/Service statistics - but not for the graphs as mentioned above.
Could you reproduce this behaviour?
Kind regards,
Constantin
This topic was automatically closed 365 days after the last reply. New replies are no longer allowed. Contact an admin if you think this should be re-opened.