we have two requirements about dashboards/websites:
Dashboard about Service Problems:
Has somebody a solution to show the Service Problems in a statistic that we will see which service type (service check command) is the main service type which filling up the service problem view?
We need a better overview about the main problems to reduce the alerts and notifications.
Dashboard about Service Notifications:
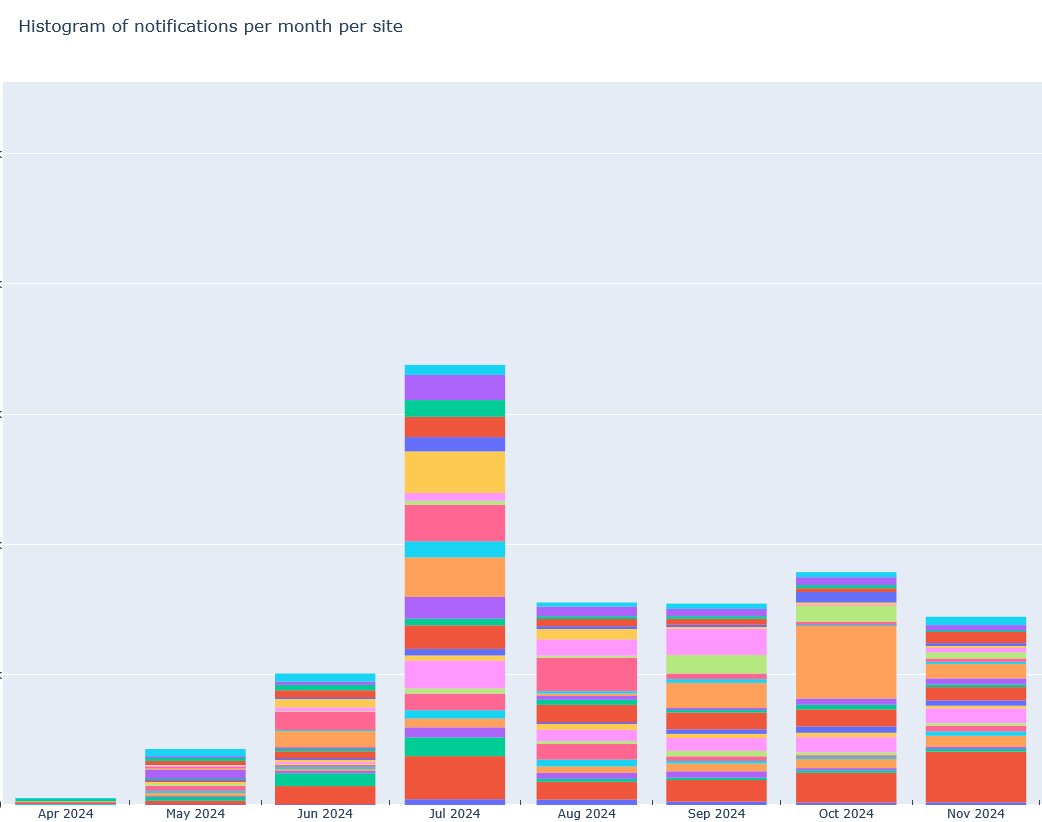
The second requirement is to get a statistic about the service notifications, which service on which host has triggered how many notifications.
Has somebody an Checkmk Dashboard or an external website programmed?
That looks good!
Graphical and further Tabular will be required for hosts and services, so get at first a graphical view and then the technical tabular view for solving the problems by the information’s out of the table details.
Is it possible to you, to share the dashlet and the info how to install it?
Just an info, we’ve just one site.
This would be great.