Don't find Filesystem / percent

Hello,

I try the new check_mk input on grafana (instead of pnp nagios), and that works, thank you for that.

However, I have some differences:

On 2.0.0p11 (CRE) With pnp-nagios, I can watch the % usage for Filesystem / with label fs_used_percent.

On 2.0.0p14 (CRE) With grafana plugin, I don’t see fs_used_percent

I don’t have this problem with RAM

On 2.0.0p11 (CRE) With pnp-nagios, I have → mem_used_percent
On 2.0.0p14 (CRE) With grafana plugin, I have → RAM used %

The Metric don’t have the same name, but it’s not a problem ^^

So, do you know why I don’t have fs_used_percent with Grafana plugin with 2.0.0p14 ?

Thank you.

Maybe this werk has fixed the issue. Worth a try.

Hello,
Thank you for suggestion.

I upgrade check_mk 2.0.0p14 to 2.0.0p16 (and the agent too).

However, the problem is the same.

Thank you.

There is a simple solution for this problem. CMK datasource only shows metrics where a graph is defined for. This is really strange :slight_smile:
For this problem with the filesystem percentage i have the following as solution.
Create a file “filesystem.py” inside your site under “~/local/share/check_mk/web/plugins/metrics/” with the following content.

#!/usr/bin/env python3
from cmk.gui.plugins.metrics import (
    graph_info,
)

graph_info["fs_used_percent"] = {
    "title": _("Filesystem usage in percent"),
    "metrics": [
        ("fs_used_percent", "area"),
    ],
    "range": (0, 100),
}

Now you should also have a own graph for every filesystem like this one.


And inside Grafana you can select a metric like shown here.
image

2 Likes

Hello, thank you for suggestion,

However I never use Python and maybe I do something wrong.

I go on :
/opt/omd/sites/OMD/local/share/check_mk/web/plugins/metrics

Then I Create the script with chmod +x.

I have this error:

# ./filesystem.py 
Traceback (most recent call last):
  File "./filesystem.py", line 2, in <module>
    from cmk.gui.plugins.metrics import (
ImportError: No module named 'cmk'

I think I have a good version:

# python -V
Python 2.7.13

# python3 -V
Python 3.5.3

Any ideas ?

Thank you.

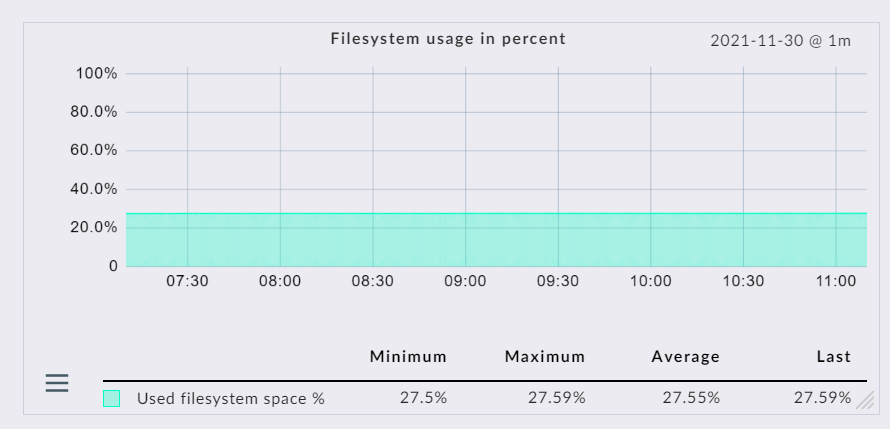
why this? The script don’t need to be executed. You only have to create the file as site user not as root. And now you should see a percent graph for your filesystem.
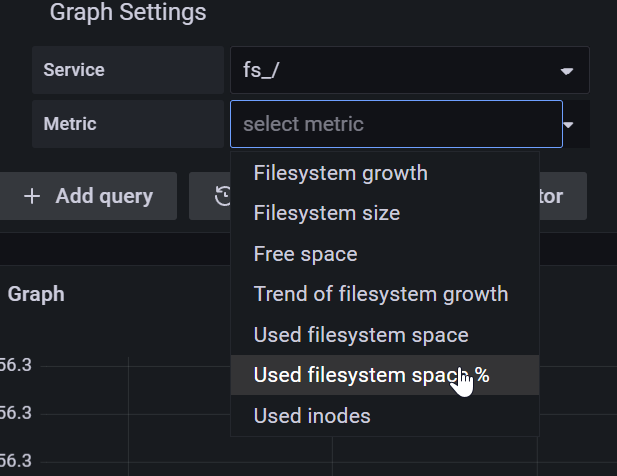
Then you can also select the percent value in Grafana.

1 Like

That works !

Thank you for advisement and your availability.

This topic was automatically closed 365 days after the last reply. New replies are no longer allowed. Contact an admin if you think this should be re-opened.