Hello Martin,
So the requirement is , we have some Host in which elastic search is there and we need to monitor this and these hosts are added in the Checkmk . we just need to enable the elastic search so that that the number of nodes etc all other services related to elastic search services can be visible along with other services of a host in the Checkmk.
For this we have added the rule following the steps mentioned in the
https://blog.checkmk.com/monitoring-elasticsearch-with-checkmk
Added the rule from “Check state of Elastic Search”
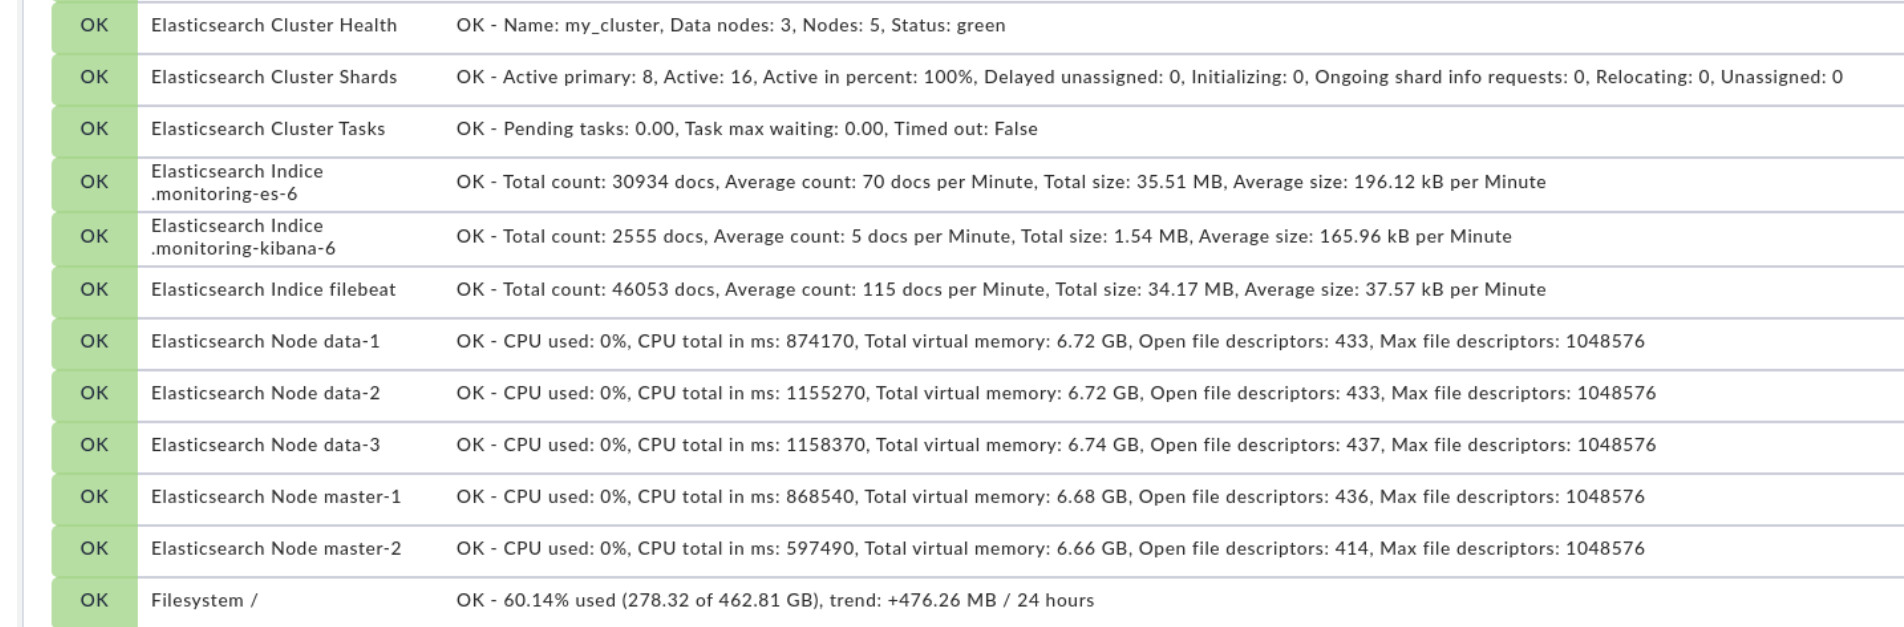
But not getting Elastic search related service in service list in checkmk just like the example given in the above link(https://blog.checkmk.com/monitoring-elasticsearch-with-checkmk)
.
Not getting like this elastic search related services in our hosts in Checkmk even after creating the rule for elastic search
I have execute the special agent with the “–debug” option to get some error messages if there are errors.
OMD[dev]:~/share/check_mk/agents/special$ ./agent_elasticsearch --debug -P http hostname “cluster_health nodes stats” -p portnumber
<<<check_mk>>>
<<<elasticsearch_cluster_health>>>
<<<check_mk>>>
Traceback (most recent call last):
File “./agent_elasticsearch”, line 32, in
sys.exit(main())
File “/dev/lib/python/cmk/special_agents/agent_elasticsearch.py”, line 52, in main
handle_request(user, pwd, opt_port, query_objects, opt_proto, opt_debug, elastic_host)
File “/dev/lib/python/cmk/special_agents/agent_elasticsearch.py”, line 78, in handle_request
response = requests.get(url)
File “/dev/lib/python/requests/api.py”, line 75, in get
return request(‘get’, url, params=params, **kwargs)
File “/dev/lib/python/requests/api.py”, line 60, in request
return session.request(method=method, url=url, **kwargs)
File “/dev/lib/python/requests/sessions.py”, line 533, in request
resp = self.send(prep, **send_kwargs)
File “/dev/lib/python/requests/sessions.py”, line 646, in send
r = adapter.send(request, **kwargs)
File “/dev/lib/python/requests/adapters.py”, line 498, in send
raise ConnectionError(err, request=request)
requests.exceptions.ConnectionError: (‘Connection aborted.’, BadStatusLine(’<<<check_mk>>>\n’,))
simplejson.errors.JSONDecodeError: Expecting value: line 1 column 1 (char 0)
Please help me how to resolve further
So for the above requirement do we need to do anything along with the rule created to get the elastic search service enabled in the Checkmk and do we need to do anything with agent_elasticsearch and why I am not getting any service related to elastic search in Checkmk like below
.
not sure How to proceed further to get the above