Hello!
After some time of using version 2.0.0p3 we faced strange issue with the services state.
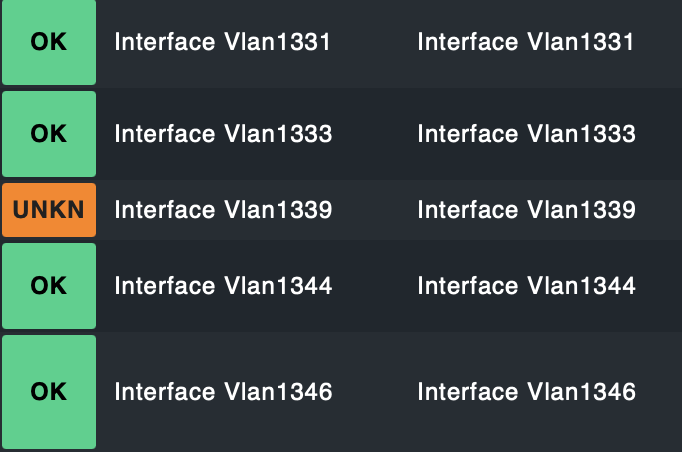
Checking service in dashboard shows "Unknown" state:
If I'll perform Full Scan - zero vanished services will be found and the same service will be in the "OK" state:


I tried to move this service to “Undecided” → Apply Changes → add service back → Apply Changes = same result.
Also tried to use: Actions → Remove all and find new.
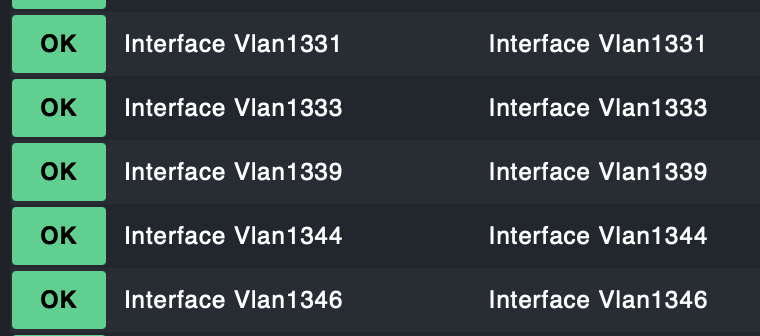
Interesting that If I'll create copy of this host and scan it for services, the same service will be shown as "OK":
Configuration on the device exist and service should be in the OK state:
ru-spb-csw-01#sh run int vlan 1339
Building configuration…
Current configuration : 279 bytes
!
interface Vlan1339
description intVL1339
ip address 172.31.26.129 255.255.255.224
ip helper-address 172.31.9.24
ip helper-address 172.31.9.23
no ip redirects
no ip unreachables
ip verify unicast source reachable-via rx
end
I checked all rules that apply to this host/interface, not found any that can affect interface state.
Part of **cmk -D** for this host
OMD[o2x_cmk]:~$ cmk -D ru-spb-csw-01
ru-spb-csw-01
Addresses: 172.31.0.1
Tags: [address_family:ip-v4-only], [agent:no-agent], [criticality:prod], [device-type:switch], [ip-v4:ip-v4], [networking:lan], [piggyback:no-piggyback], [site:o2x_cmk], [snmp:snmp], [snmp_ds:snmp-v2]
Labels:
Host groups: all-russia, 24x7_dashboard
Contact groups: all
Agent mode: No agent
Type of agent: SNMP (Community: ‘community’, Bulk walk: yes, Port: 161, Backend: Inline)
Services:
checktype item params description groups
cisco_cpu_multiitem Switch 1 {‘levels’: (80.0, 90.0)} CPU utilization Switch 1
if64 GigabitEthernet1/0/1 {‘errors’: {‘both’: (‘perc’, (7.01, 9.001))}, ‘discovered_oper_status’: [‘1’], ‘discovered_speed’: 1000000000, ‘unit’: ‘bit’, ‘state’: [‘1’]} Interface GigabitEthernet1/0/1
if64 GigabitEthernet2/0/1 {‘errors’: {‘both’: (‘perc’, (7.01, 9.001))}, ‘discovered_oper_status’: [‘1’], ‘discovered_speed’: 1000000000, ‘unit’: ‘bit’, ‘state’: [‘1’]} Interface GigabitEthernet2/0/1
if64 Port-channel28 {‘errors’: {‘both’: (‘perc’, (7.01, 9.001))}, ‘discovered_oper_status’: [‘1’], ‘discovered_speed’: 4000000000, ‘unit’: ‘bit’, ‘state’: [‘1’]} Interface Port-channel28
if64 Vlan1331 {‘errors’: {‘both’: (‘perc’, (7.01, 9.001))}, ‘discovered_oper_status’: [‘1’], ‘discovered_speed’: 1000000000, ‘unit’: ‘bit’, ‘state’: [‘1’]} Interface Vlan1331
if64 Vlan1333 {‘errors’: {‘both’: (‘perc’, (7.01, 9.001))}, ‘discovered_oper_status’: [‘1’], ‘discovered_speed’: 1000000000, ‘unit’: ‘bit’, ‘state’: [‘1’]} Interface Vlan1333
if64 Vlan1339 {‘errors’: {‘both’: (‘perc’, (7.01, 9.001))}, ‘discovered_oper_status’: [‘1’], ‘discovered_speed’: 1000000000, ‘unit’: ‘bit’, ‘state’: [‘1’]} Interface Vlan1339
Anyone that faced similar issue here? Would be glad to hear any suggestions 
Thanks!