when i try to add a sensor to minitor or disable, if my host have a lot of sensors available (some hosts have around 800+ sensors)à
i get this error:
Error running automation call analyze-service-rule-matches: Your request timed out after 110 seconds. This issue may be related to a local configuration problem or a request which works with a too large number of objects. But if you think this issue is a bug, please send a crash report.
I’ve not seen the analyze service rule matches time out before. SNMP poll timeout, sure, but not that part of the discovery.
First and foremost, what’s your Checkmk server load average max, memory used max, and disk IO/disk wait? If all these are good, then I am not quite sure what to suggest.
For some of my cusomters’ larger SNMP network devices I have to do discovery from the CLI because they time out in the UI, but it’s not for the reason you are timing out. Maybe that might help, maybe not. This official doc can give you some guidance if you want to try CLI discovery
cli discovery usually works, but if possible it would be nice not to have to rely on cli discovery when we go on production, not everyone on my team is fluent in this and i cannot ask my end user to use cli…
That’s the kind of large of device device I have the UI SNMP timeouts on.
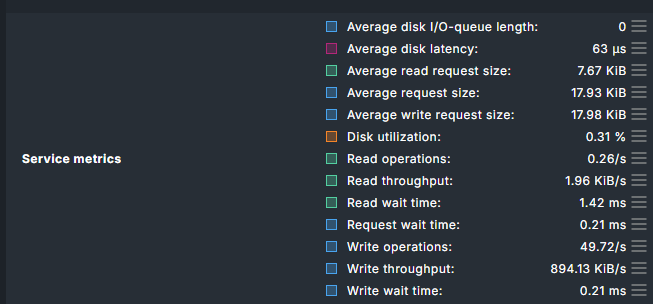
To clarify, I was not meaning the fill percentage of the disk, but the IO bandwidth or disk wait. You can check in the Disk IO Summary service of your Checkmk server (if you monitor your server). I am thinking specifically of “* Wait time” and “* throughput”
Utilization: 2.34% Read: 7.28 kB/s Write: 1.15 MB/s Average wait: 2 milliseconds Average read wait: 14 milliseconds Average write wait: 2 milliseconds Average queue length: 0.00 Read operations: 1.78/s Write operations: 55.94/s Latency: 406 microseconds
and the error_log:
```
cat ~/var/log/apache/error_log
[Wed Jun 17 00:00:04.718171 2026] [mpm_prefork:notice] [pid 2017495] AH00163: Apache/2.4.58 (Ubuntu) mod_wsgi/5.0.2 Python/3.13 mod_fcgid/2.3.9 configured – resuming normal operations
[Wed Jun 17 00:00:04.718218 2026] [core:notice] [pid 2017495] AH00094: Command line: ‘/usr/sbin/apache2 -f /omd/sites/monitoring/etc/apache/apache.conf’
[Wed Jun 17 00:00:06.859697 2026] [wsgi:error] [pid 3053503] /etc/timezone is deprecated in some distros, and no longer reliable. tzlocal is ignoring it, and you can likely delete it.
[Wed Jun 17 00:10:03.518332 2026] [wsgi:error] [pid 3069080] /etc/timezone is deprecated in some distros, and no longer reliable. tzlocal is ignoring it, and you can likely delete it.
[Wed Jun 17 07:31:44.537596 2026] [wsgi:error] [pid 3774822] /etc/timezone is deprecated in some distros, and no longer reliable. tzlocal is ignoring it, and you can likely delete it.
[Wed Jun 17 07:43:56.091472 2026] [wsgi:error] [pid 3799558] /etc/timezone is deprecated in some distros, and no longer reliable. tzlocal is ignoring it, and you can likely delete it.```
is the service metrics you linked inside “Disk IO summary” sensor or is it something else?