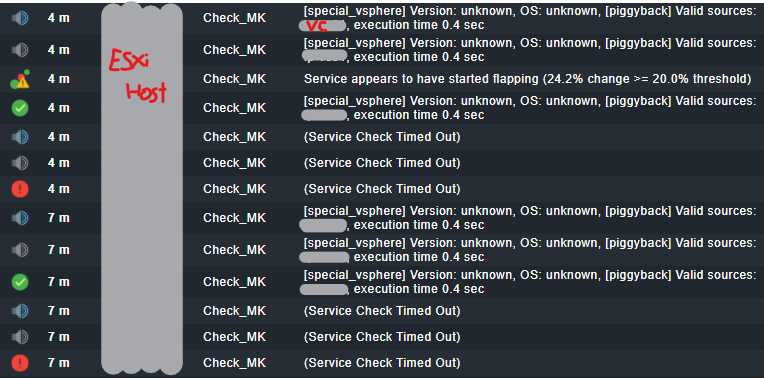
Hey there, I was wondering if someone had had the same issue or something similar. I’m getting a lot of notifications about one of our ESXi servers. It’s always related to a service check timeout, which I changed to 120s in the global config file because we had other machines, mostly label printers, that needed the longer timeout.
Every time this happens, I get a notification and less than a second after, it uses the piggyback data from our vCenter to indicate the host is up. I’ve tried adding a " Maximum number of check attempts for host" rule set on 3 and a “Retry check interval for host checks” rule set for 40 seconds. It even ignores the “delay host notifications” rule that I’ve set on 1 minute for all hosts.
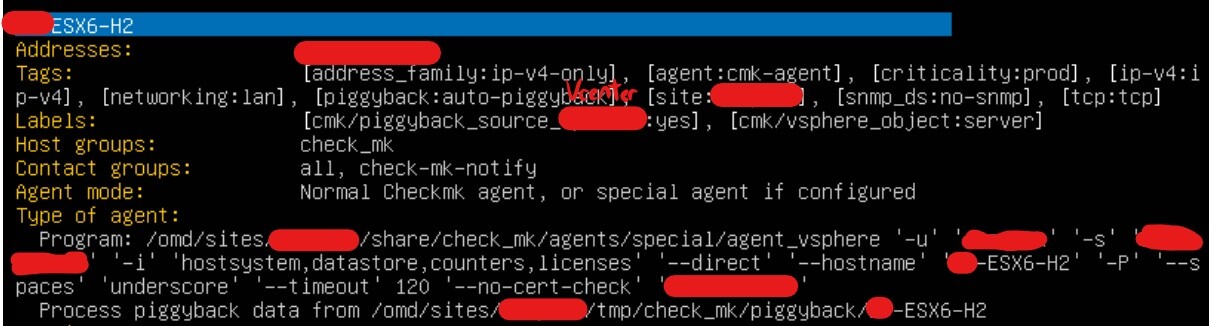
I have configured the “VMWare ESX via vSphere” rule on both of them.
I don’t have this problem with my 2 other ESXi hosts, only this one. This one had the CheckMK virtual machine running on it so I moved it, but still had the same issue with that specific ESXi host. The problem seems to happen more out of office hours.
So, small update, a bit after I posted this (which was after I moved the CheckMK virtual machine to our second ESXi host (it was on the first one)) the connection timeout issue moved to our third ESXi host. Both hosts that have connection timeouts seem to have SQL servers installed on them, so it might be a problem with the server not being able to respond quickly enough when there is a lot of load from the SQL servers.
Would that help narrow down a cause ? I simply masked the site name, IPs and name of computers, sorry if it makes it confusing, had to be done
P.s., just in case, that’s from the host that just started timing out, both should be configured the same!:
The host is configured as direct ESX host for the special agent. But now the question why is it using piggyback data from somewhere (vCenter?) else.
If you have a vCenter then it is enough to query this and only use piggyback data for the hosts itself.
A little bit more load on the ESX should be no reason for timeouts on the API. If this is the case then also your vCenter gets no data as this is using the same API calls.
Thanks for the heads-up about the password, good thing that was a read-only test user that’s only there because I didn’t know what to try anymore, so not a main account
Also, maybe I don’t understand piggybacking enough, but I wanted to query most of my info from the vCenter itself, but have the hardware info of the ESXi, which isn’t possible from the vCenter as far as I understand.
Would there be a way to get more information about the timeout? I still have no idea where to find the right logs (if they even exist) which might help a bunch!
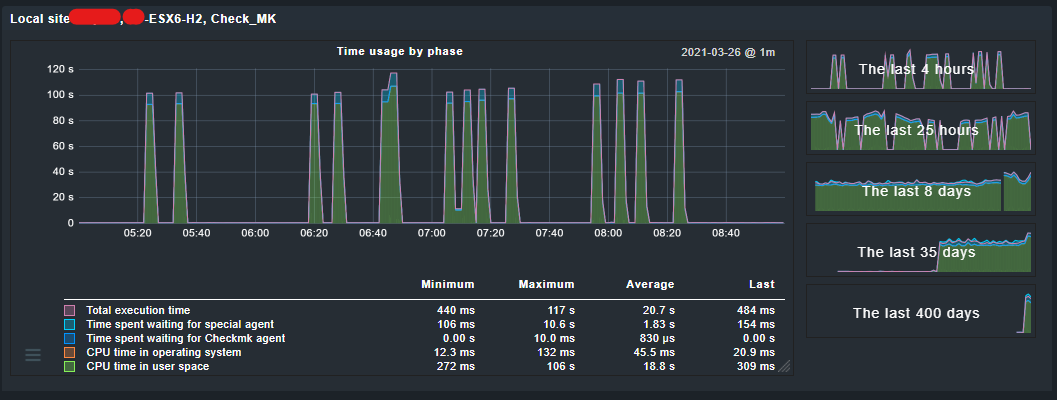
Can you have a look at the agent execution time. It is a timeout from the special agent script and should also happen if you execute it manually. Not every execution but from time to time.
That’d be great, I can’t seem to query CPU and RAM info of the ESXi hosts from the vCenter directly, I’ll have a look soon to see if I might have left some options disabled by default or something similar.
My couple service scans seem to be running for about 4 to 6 seconds each on average.
If this can help, I’m still relatively new to checkmk so I didn’t know how to access that graph before, but it seems to be something about my CPU. Its utilisation is quite low, but the “time spent in user space” is quite high sometimes (117s at max), other times it goes down to 500ms. I might have to take this to VMWare, but maybe you or someone would know:
These values should all stay around 1 second or two seconds maximum.
Do you see anything if you query the host manually on the command line with the command you showed in the post before?
The image I just sent was the graph for the check_mk service, so I tried using the cmk -nv command to see what the output was using the command line. If I query my vCenter user the “cmk -nv” coommand, I see all of my services and their states. If I run the same command but using the IP address or hostname of the ESXi hosts, I only get
FETCHING DATA
Piggyback file ‘/omd/sites/CheckMKSite/tmp/check_mk/piggyback/ESXiHost/vCenter’’: vCenter’
Piggyback file ‘/omd/sites/CheckMKSite/tmp/check_mk/piggyback/ESXiHost/vCenter’’: vCenter’
[PiggybackFetcher] Execute data source
PARSE FETCHER RESULTS
Received no piggyback data
Piggyback file ‘/omd/sites/CheckMKSite/tmp/check_mk/piggyback/ESXiHost/vCenter’: vCenter’
Piggyback file ‘/omd/sites/CheckMKSite/tmp/check_mk/piggyback/ESXiHost/vCenter’’: vCenter’
[piggyback] Valid sources: vCenter’, vCenter’, execution time 0.1 sec | execution_time=0.060 user_time=0.060 system_time=0.000 children_user_time=0.000 children_system_time=0.000 cmk_time_agent=0.000
I’ll continue testing on my side, but thanks for the help, I’m looking at places I wouldn’t have checked before, gotta get used to checkmk, that’s for sure
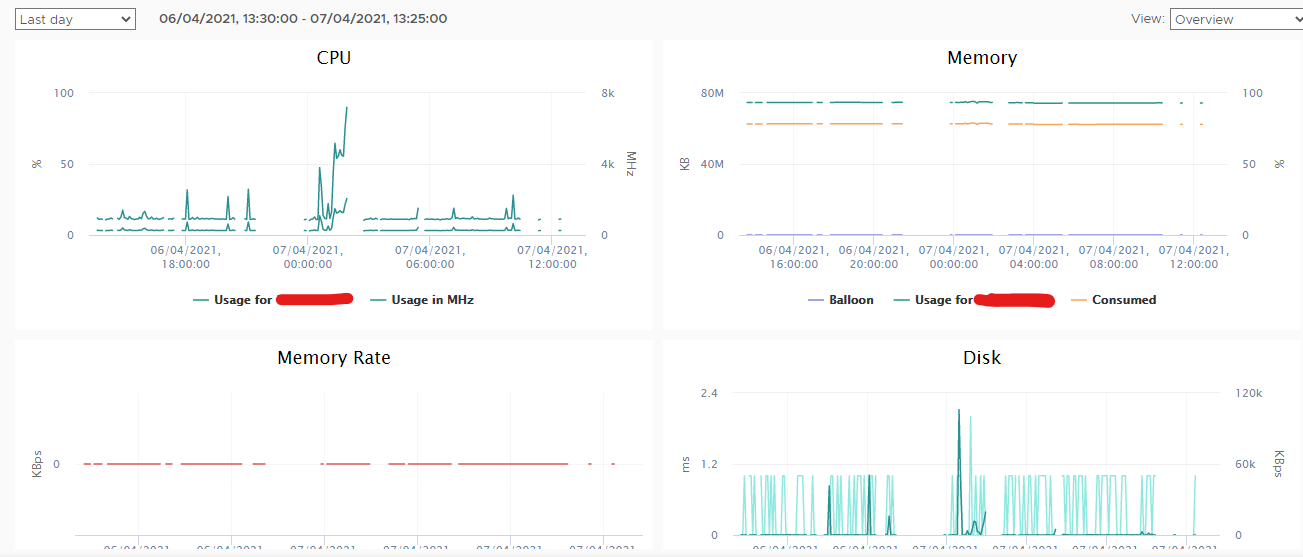
I will probably move this to VMWare, after some digging around, I realized that the performance graphs from vCenter were missing information at random intervals for these two hosts, which probably isn’t right at all.
This topic was automatically closed 365 days after the last reply. New replies are no longer allowed. Contact @fayepal if you think this should be re-opened.