Can anyone help me troubleshoot why we’re getting Yellow?
We just bought this server and implemented it. I can’t find anything in a WARN state via any GUI or otherwise.
CMK version:
Checkmk Enterprise Edition 2.1.0p33
OS version:
Ubuntu 18.04.6 LTS
Error message:
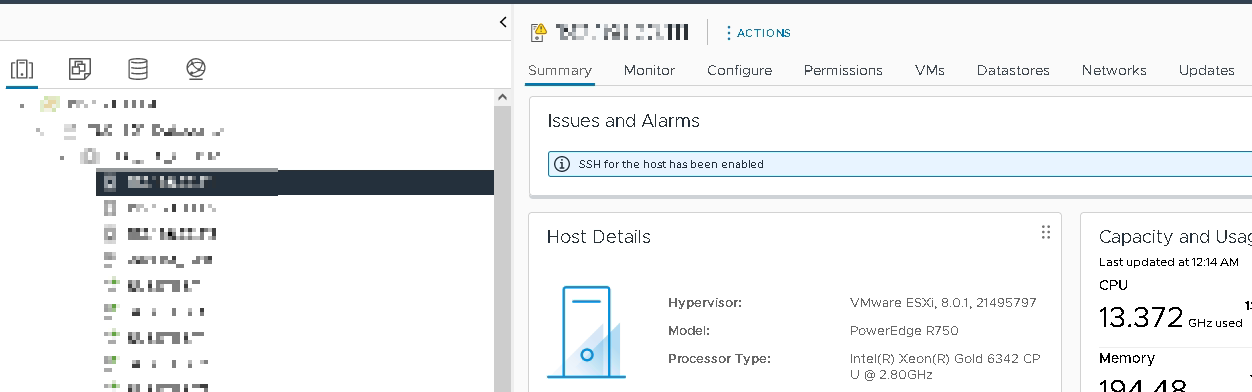
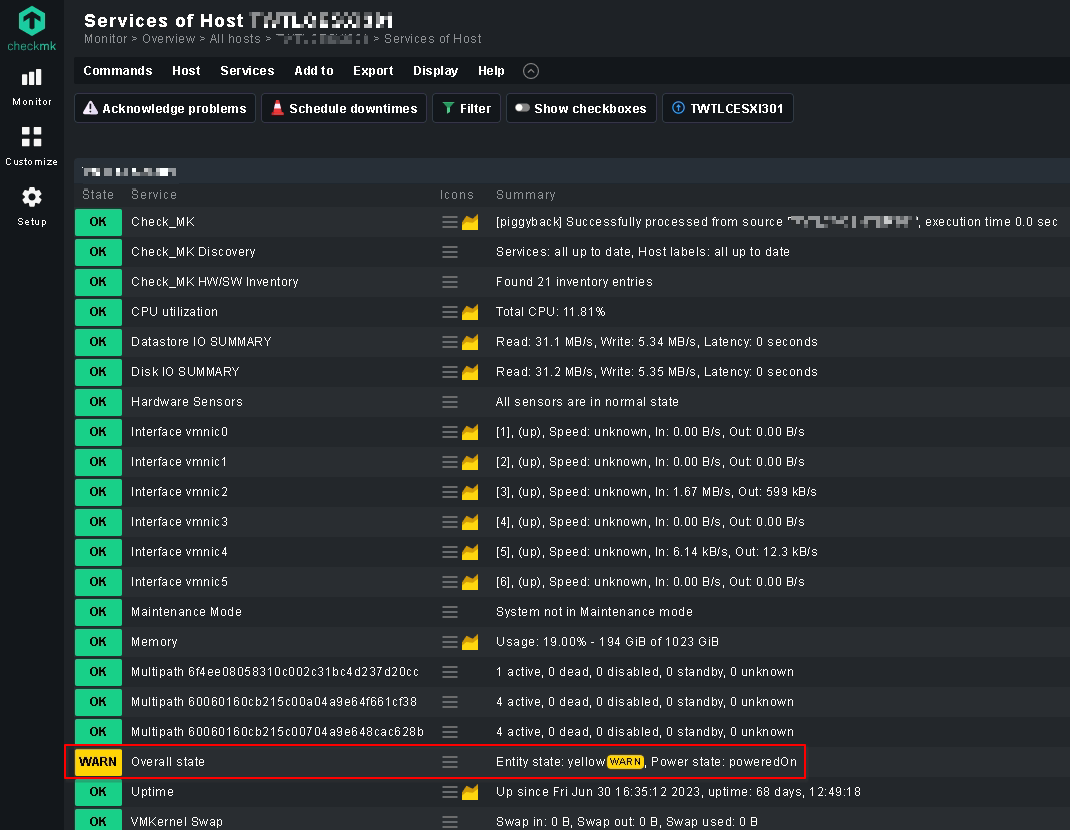
Entity state: yellowWARN, Power state: poweredOn
Output of “cmk --debug -vvn hostname”: (If it is a problem with checks or plugins)
Checkmk version 2.1.0p33
Try license usage history update.
Trying to acquire lock on /omd/sites/mysite/var/check_mk/license_usage/next_run
Got lock on /omd/sites/mysite/var/check_mk/license_usage/next_run
Trying to acquire lock on /omd/sites/mysite/var/check_mk/license_usage/history.json
Got lock on /omd/sites/mysite/var/check_mk/license_usage/history.json
Next run time has not been reached yet. Abort.
Releasing lock on /omd/sites/mysite/var/check_mk/license_usage/history.json
Released lock on /omd/sites/mysite/var/check_mk/license_usage/history.json
Releasing lock on /omd/sites/mysite/var/check_mk/license_usage/next_run
Released lock on /omd/sites/mysite/var/check_mk/license_usage/next_run
+ FETCHING DATA
Source: SourceType.HOST/FetcherType.PROGRAM
[cpu_tracking] Start [7f43ef8f60d0]
[ProgramFetcher] Fetch with cache settings: DefaultAgentFileCache(MYSERVER, base_path=/omd/sites/mysite/tmp/check_mk/data_source_cache/special_vsphere, max_age=MaxAge(checking=0, discovery=120, inventory=120), disabled=False, use_outdated=False, simulation=False)
Not using cache (Too old. Age is 55 sec, allowed is 0 sec)
[ProgramFetcher] Execute data source
Calling: /omd/sites/mysite/share/check_mk/agents/special/agent_vsphere '-u' 'monitor' '-s=21_bridges_HERE$$' '-i' 'hostsystem,datastore,counters' '--direct' '--hostname' 'MYSERVER' '-P' '--spaces' 'underscore' '--no-cert-check' '192.168.1.19'
Write data to cache file /omd/sites/mysite/tmp/check_mk/data_source_cache/special_vsphere/MYSERVER
Trying to acquire lock on /omd/sites/mysite/tmp/check_mk/data_source_cache/special_vsphere/MYSERVER
Got lock on /omd/sites/mysite/tmp/check_mk/data_source_cache/special_vsphere/MYSERVER
Releasing lock on /omd/sites/mysite/tmp/check_mk/data_source_cache/special_vsphere/MYSERVER
Released lock on /omd/sites/mysite/tmp/check_mk/data_source_cache/special_vsphere/MYSERVER
[cpu_tracking] Stop [7f43ef8f60d0 - Snapshot(process=posix.times_result(user=0.0, system=0.010000000000000009, children_user=0.27, children_system=0.02, elapsed=0.369999997317791))]
Source: SourceType.HOST/FetcherType.PIGGYBACK
[cpu_tracking] Start [7f43ef8f6370]
[PiggybackFetcher] Fetch with cache settings: NoCache(MYSERVER, base_path=/omd/sites/mysite/tmp/check_mk/data_source_cache/piggyback, max_age=MaxAge(checking=0, discovery=120, inventory=120), disabled=True, use_outdated=False, simulation=False)
Not using cache (Cache usage disabled)
[PiggybackFetcher] Execute data source
No piggyback files for 'MYSERVER'. Skip processing.
Piggyback file '/omd/sites/mysite/tmp/check_mk/piggyback/192.168.1.19/vcenter-instance': Successfully processed from source 'vcenter-instance'
Not using cache (Cache usage disabled)
[cpu_tracking] Stop [7f43ef8f6370 - Snapshot(process=posix.times_result(user=0.0, system=0.0, children_user=0.0, children_system=0.0, elapsed=0.0))]
+ PARSE FETCHER RESULTS
Source: SourceType.HOST/FetcherType.PROGRAM
<<<esx_systeminfo>>> / Transition NOOPParser -> HostSectionParser
<<<esx_vsphere_datastores:sep(9)>>> / Transition HostSectionParser -> HostSectionParser
<<<esx_vsphere_counters:sep(124)>>> / Transition HostSectionParser -> HostSectionParser
<<<esx_vsphere_hostsystem>>> / Transition HostSectionParser -> HostSectionParser
<<<esx_vsphere_sensors:sep(59)>>> / Transition HostSectionParser -> HostSectionParser
Transition HostSectionParser -> NOOPParser
<<<esx_vsphere_objects:sep(9)>>> / Transition NOOPParser -> HostSectionParser
Transition HostSectionParser -> NOOPParser
<<<systemtime>>> / Transition NOOPParser -> HostSectionParser
No persisted sections
-> Add sections: ['esx_systeminfo', 'esx_vsphere_counters', 'esx_vsphere_datastores', 'esx_vsphere_hostsystem', 'esx_vsphere_objects', 'esx_vsphere_sensors', 'systemtime']
Source: SourceType.HOST/FetcherType.PIGGYBACK
<<<esx_vsphere_counters:cached(1694013795,90):sep(124)>>> / Transition NOOPParser -> HostSectionParser
<<<esx_vsphere_hostsystem:cached(1694013795,90)>>> / Transition HostSectionParser -> HostSectionParser
<<<esx_vsphere_sensors:cached(1694013795,90):sep(59)>>> / Transition HostSectionParser -> HostSectionParser
<<<labels:sep(0)>>> / Transition HostSectionParser -> HostSectionParser
No persisted sections
-> Add sections: ['esx_vsphere_counters', 'esx_vsphere_hostsystem', 'esx_vsphere_sensors', 'labels']
Received no piggyback data
Received no piggyback data
[cpu_tracking] Start [7f43ef8f6700]
value store: synchronizing
Trying to acquire lock on /omd/sites/mysite/tmp/check_mk/counters/MYSERVER
Got lock on /omd/sites/mysite/tmp/check_mk/counters/MYSERVER
value store: loading from disk
Releasing lock on /omd/sites/mysite/tmp/check_mk/counters/MYSERVER
Released lock on /omd/sites/mysite/tmp/check_mk/counters/MYSERVER
CPU utilization Total CPU: 9.15%
Datastore IO SUMMARY Read: 77.00 kB/s, Write: 837.00 kB/s, Latency: 0.00 ms, Read latency: 2.67 ms, Write latency: 0.00 ms, Read operations: 0.00 1/s, Write operations: 0.00 1/s
Disk IO SUMMARY Read: 102 kB/s, Write: 858 kB/s, Latency: 0 seconds
Filesystem MYSERVER-SAS 13.1% used (1.91 of 14.55 TB), trend: -222.22 GB / 24 hours, Uncommitted: 1.90 TB, Provisioning: 26.15%
Filesystem MYSERVER-SSD 0.04% used (1.46 GB of 3.49 TB), trend: 0.00 B / 24 hours, Uncommitted: 0.00 B, Provisioning: 0.04%
Filesystem datastore1 1.48% used (1.41 of 95.25 GB), trend: 0.00 B / 24 hours, Uncommitted: 0.00 B, Provisioning: 1.48%
Hardware Sensors All sensors are in normal state
HostSystem MYSERVER power state: poweredOn
Interface vmnic0 [1], (up), MAC: B4:45:06:F6:20:EE, Speed: 1 GBit/s, In: 1.54 MBit/s (0.15%), Out: 893 kBit/s (0.09%)
Interface vmnic1 [2], (up), MAC: B4:45:06:F6:20:EF, Speed: 1 GBit/s, In: 98.3 kBit/s (<0.01%), Out: 0 Bit/s (0%)
Interface vusb0 [5], (up), MAC: B4:45:06:F6:20:EB, Speed: 100 MBit/s, In: 0 Bit/s (0%), Out: 0 Bit/s (0%)
Maintenance Mode System not in Maintenance mode
Memory used Usage: 47.07% - 60.0 GiB of 127 GiB
Multipath 3033343534336237663733393030313000000000 1 active, 0 dead, 0 disabled, 0 standby, 0 unknown
Multipath 61c721d06b4b78002c39573c6519aad1 1 active, 0 dead, 0 disabled, 0 standby, 0 unknown
Multipath 61c721d06b4b78002c3957bc22cc2245 1 active, 0 dead, 0 disabled, 0 standby, 0 unknown
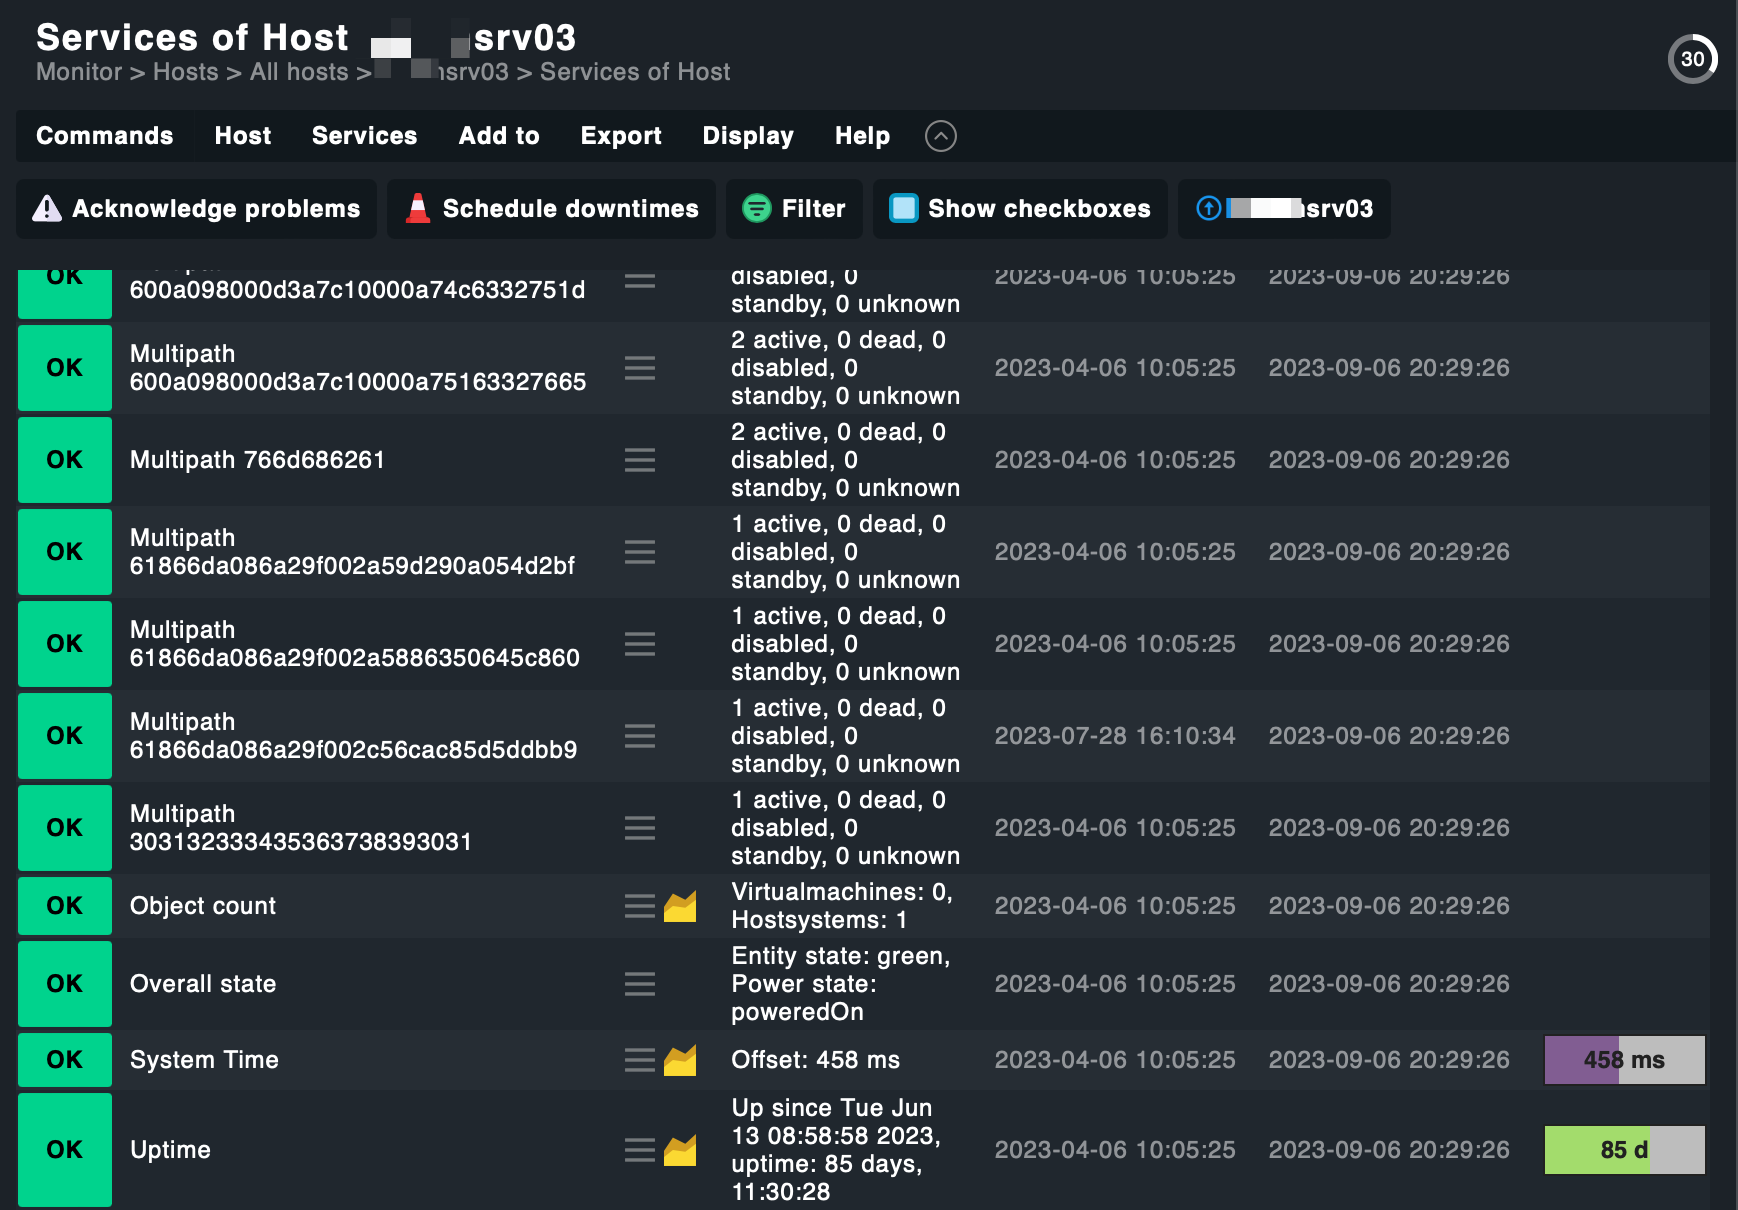
Object count Virtualmachines: 0, Hostsystems: 1
Overall state Entity state: yellow(!), Power state: poweredOn
System Time Offset: -1.24 s
Uptime Up since Sun Sep 3 07:41:50 2023, uptime: 3 days, 2:41:30
VMKernel Swap Swap in: 0.00 KB, Swap out: 0.00 KB, Swap used: 0.00 KB
No piggyback files for 'MYSERVER'. Skip processing.
Piggyback file '/omd/sites/mysite/tmp/check_mk/piggyback/192.168.1.19/vcenter-instance': Successfully processed from source 'vcenter-instance'
[cpu_tracking] Stop [7f43ef8f6700 - Snapshot(process=posix.times_result(user=0.010000000000000009, system=0.0, children_user=0.0, children_system=0.0, elapsed=0.009999997913837433))]
[special_vsphere] Success, [piggyback] Successfully processed from source 'vcenter-instance', execution time 0.4 sec | execution_time=0.380 user_time=0.010 system_time=0.010 children_user_time=0.270 children_system_time=0.020 cmk_time_ds=0.070 cmk_time_agent=0.000