Hello, everyone,
I’d like to create a graph in CheckMK using the “Events of Service” information.
The idea is to have graphs arranged one below the other with the same time range, and then one showing OK, Warning, and Critical events with the information from “Events of Service.”
Is this possible, and if so, how?
Best regards
Roman
You can integrate the view inside a dashboard but you need to do two steps manually.
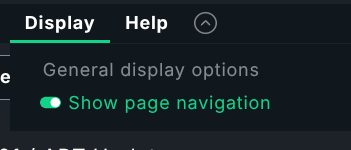
First you need the real URL to this view. After you have build the availability view like you want it, you need to unselect the display option
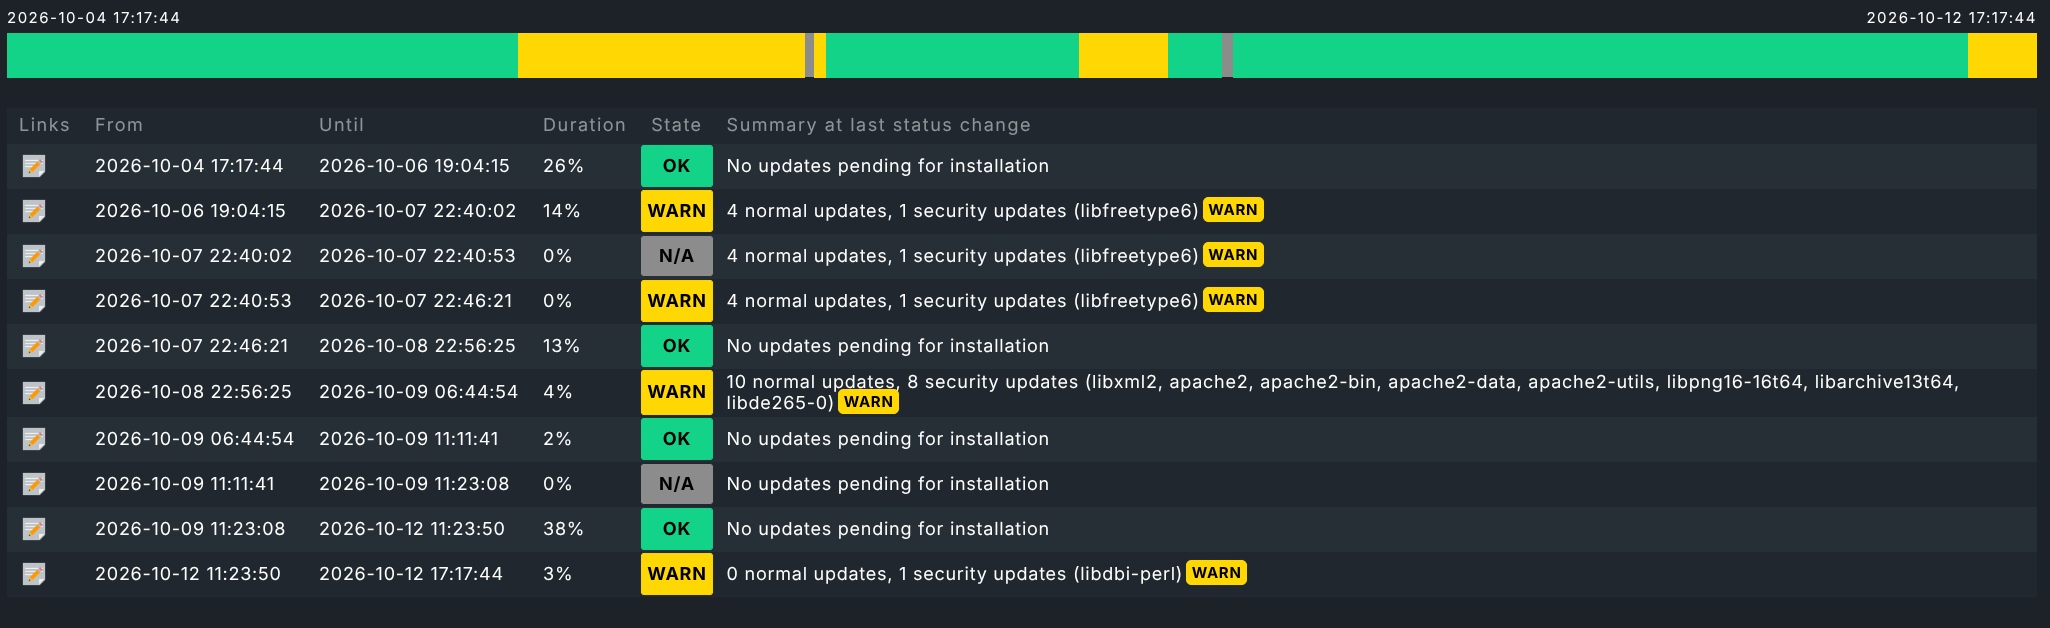
Now you have only your view with the complete URL to this view.
At the end of this URL you need to add “&display_options=t”. That is important to hide the menu structure on the dashboard later.
Now on your dashboard you insert a new element of type → “Other elements” → “Embed URL”
Here you can insert your copied URL as relative URL → ./view.py…
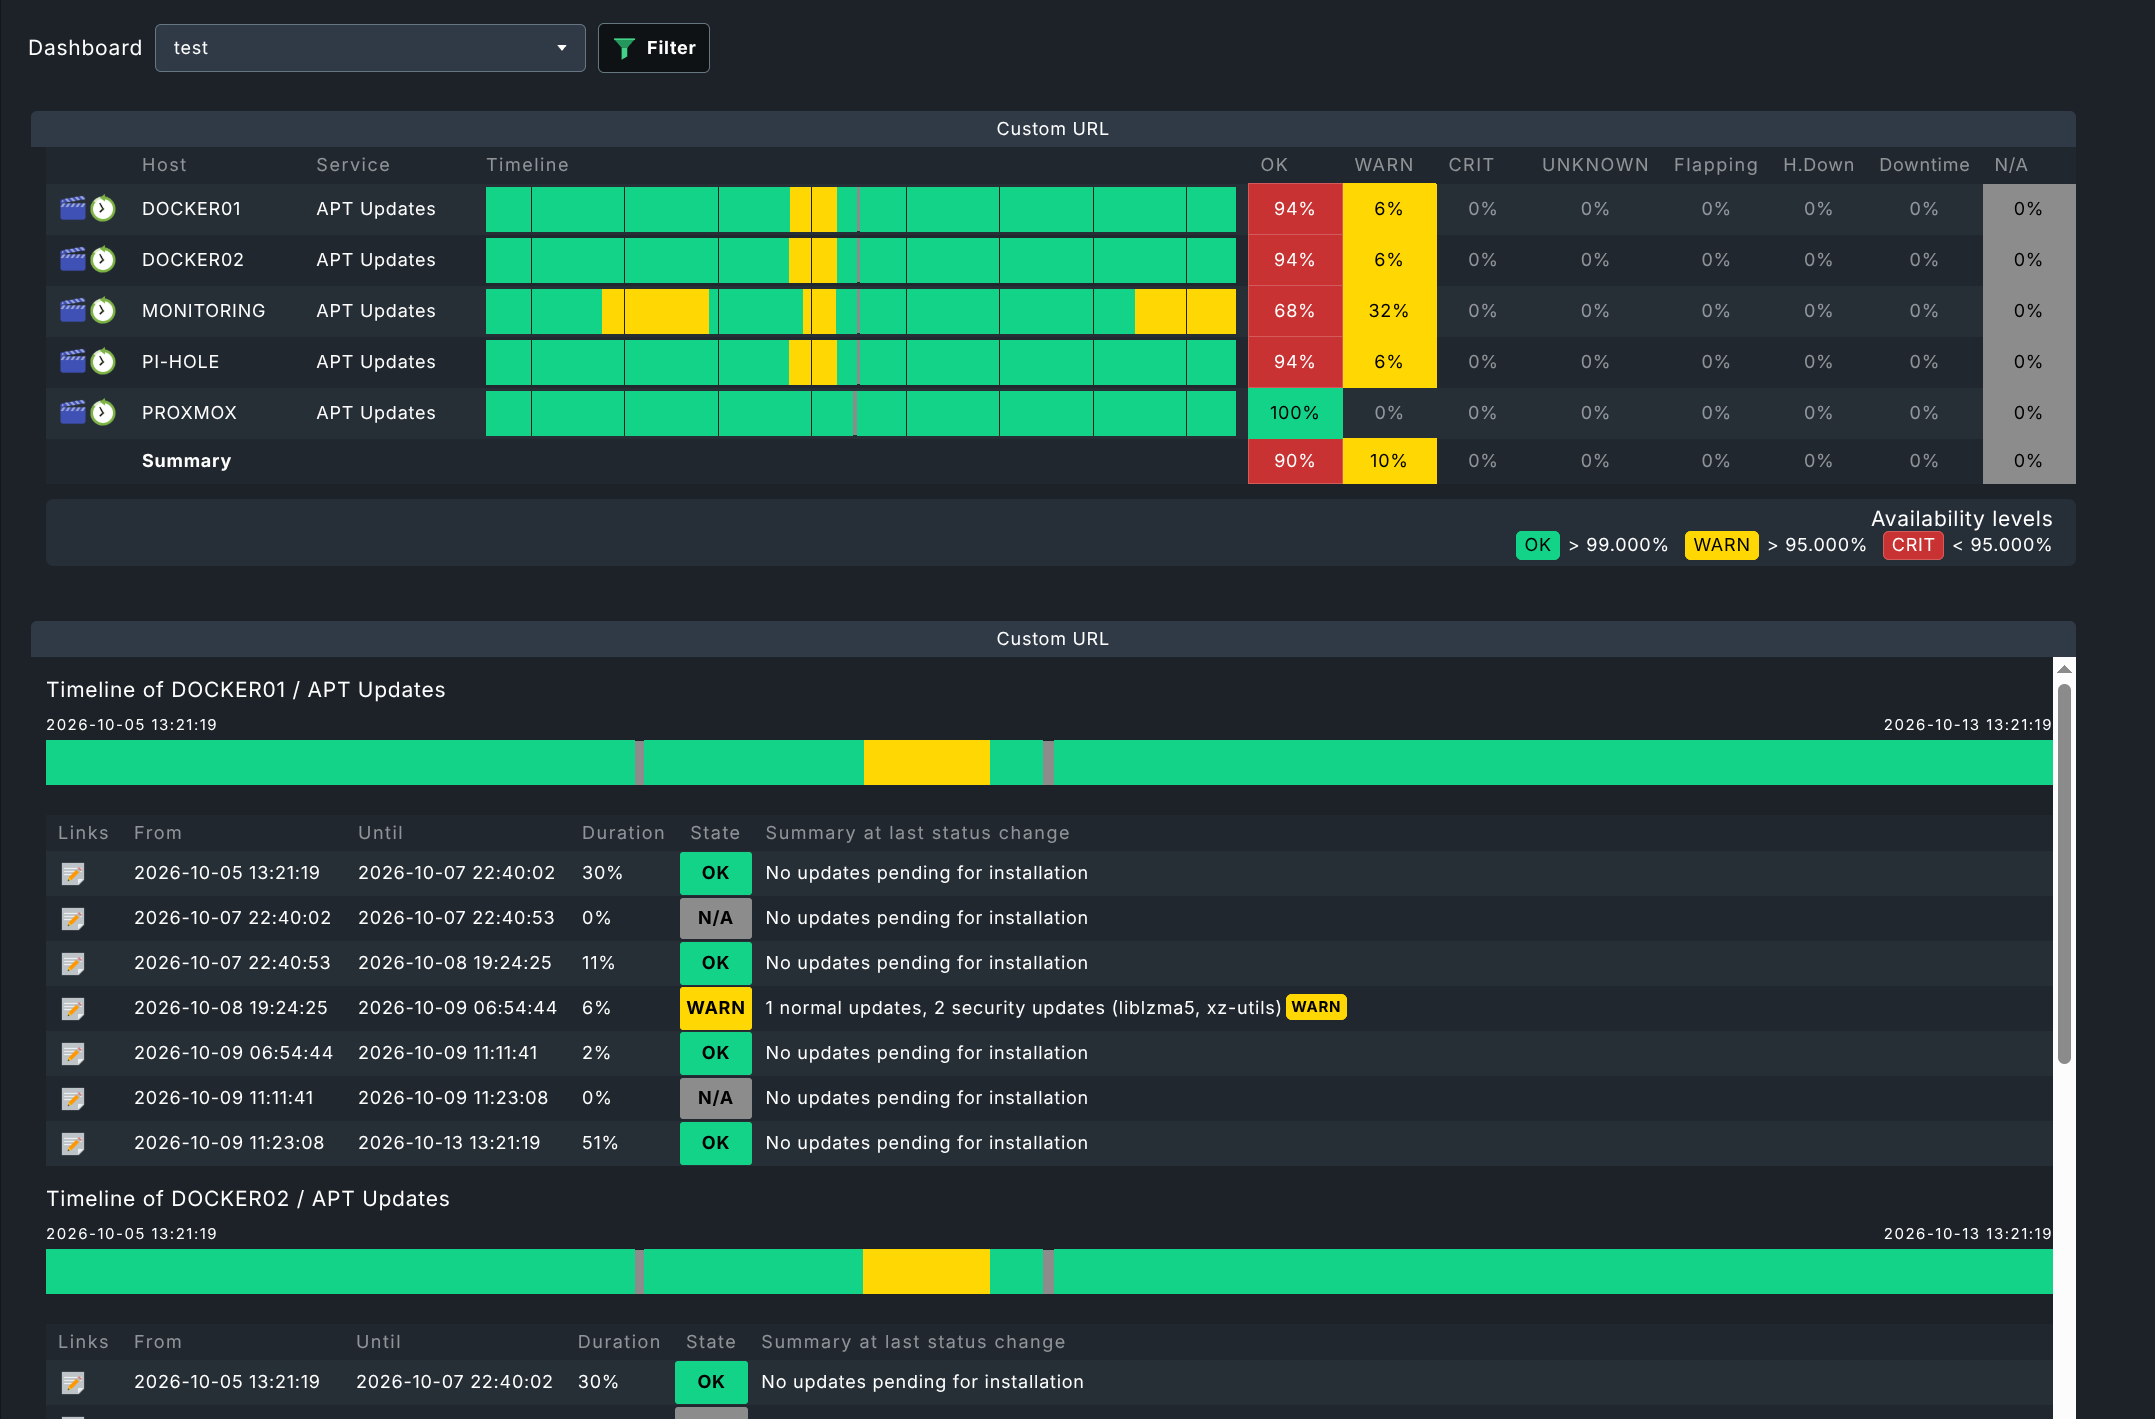
Result should be something like this.
These are two different views embedded the same way.
But keep in mind that the availability is calculated every refresh of this page element. I would not recommend to have longer time ranges.
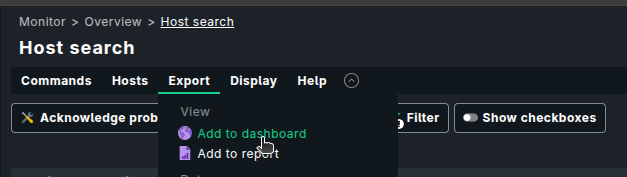
To embed a View, you don’t have to use the Embed URL widget. You can directly embed a View in the dashboard by using the Views widget (link to existing view option) or by selecting the “Add to dashboard” option from the View page itself.