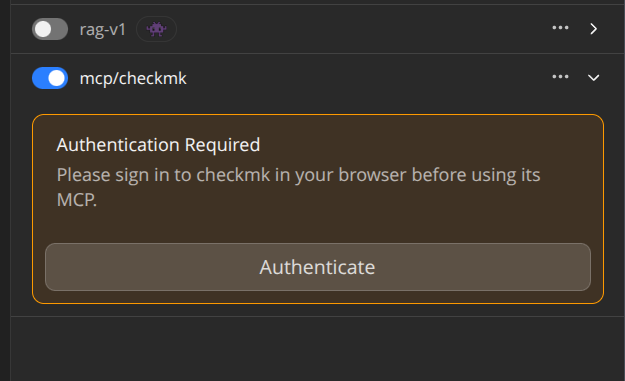
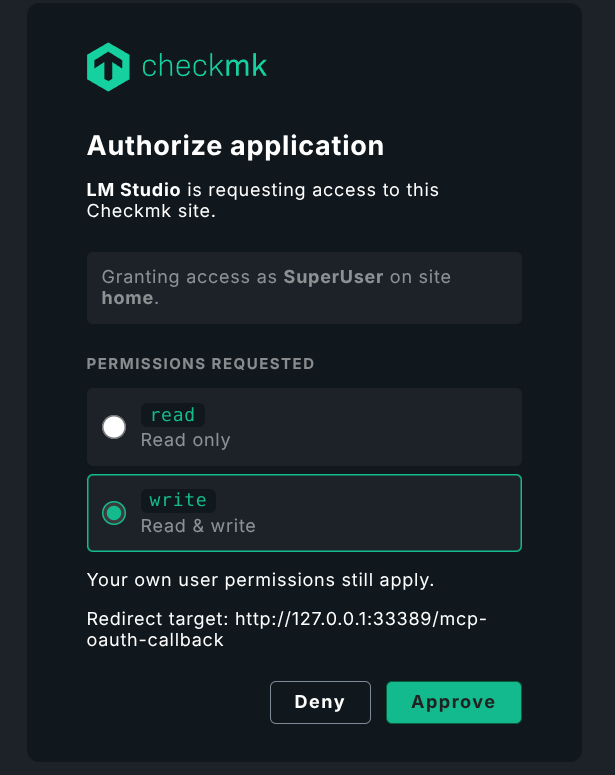
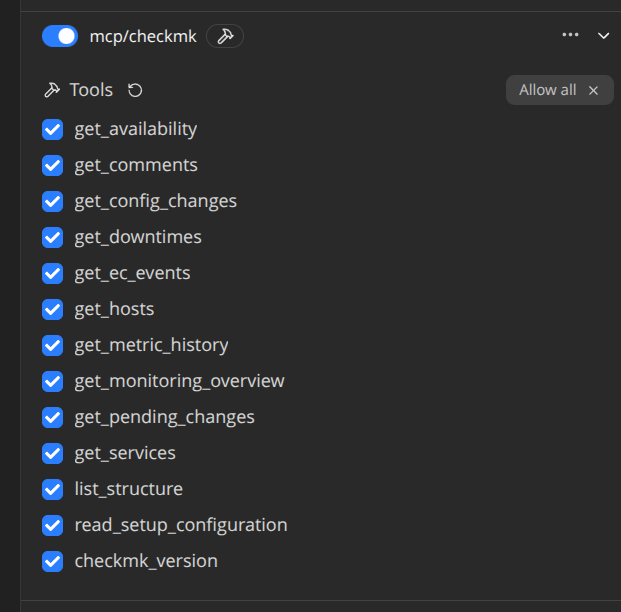
After reading your post i made some smaller test with “LM Studio” and three models (gpt-oss-20b, qwen3.8-27b and qwen3.5-9b) all models are producing some results.
I don’t want to judge if this will be helpful in a day to day business, but it was working. One thing you must keep in mind, the context length needed in my local tests was every time around 30-40k minimum. 20k context crashed regularly.
With only 16GB VRAM context is very limited 
For me, qwen3.5-9b yielded the best result in terms of the balance between time and response quality.
Small example from my test.
What is the current status of my CO2 device?
First thought was the longest time. 6,5 seconds
The user is asking about the current status of their “CO2 device”. This sounds like they want to check a host or service in their monitoring system. I need to use the get_hosts function to find information about this device.
However, I don’t know the exact host name for the “CO2 device”. The user might have named it something specific. Let me try to query for hosts that might be related to CO2. I could try searching for hosts with “CO2” in their name, or I could first get a monitoring overview to see what’s available.
Actually, let me think about this more carefully. The user is asking about “my CO2 device” which suggests they have a specific host/service named something like “co2-device”, “co2-sensor”, etc. Since I don’t know the exact name, I should probably:
- First try to get hosts with “CO2” in the name
- Or get a monitoring overview to see what’s available
Let me start by trying to find hosts that might be related to CO2. I’ll use get_hosts with host_name parameter set to something like “co2” but looking at the function definition, it seems host_name expects exact matches or an array of exact matches, not a wildcard pattern.
Actually, looking at the get_hosts function more carefully:
- host_name: “Only these exact hosts. A host name not visible on this site fails the whole call and is named, so a typo can’t read as an all-clear.”
So I need to know the exact host name. Since the user said “CO2 device”, they might have named it something like:
- co2-device
- CO2-device
- co2-sensor
- co2-monitor
But I don’t want to guess. Let me first get a monitoring overview to see what hosts are available, or I could try searching for hosts with common naming patterns.
Actually, let me try a different approach. Let me get the monitoring overview first to see what’s on the site, and then I can identify if there’s a CO2-related host.
Tool call - get_monitoring_overview
Result
[
  {
    "type": "text",
    "text": "{\n  \"hosts\": {\n    \"total_matched\": 25,\n    \"state_counts\": {\n      \"UP\": 25,\n      \"DOWN\": 0,\n      \"UNREACH\": 0,\n      \"PENDING\": 0\n    },\n    \"unhandled_state_counts\": {\n      \"DOWN\": 0,\n      \"UNREACH\": 0\n    }\n  },\n  \"services\": {\n    \"total_matched\": 408,\n    \"state_counts\": {\n      \"OK\": 402,\n      \"WARN\": 0,\n      \"CRIT\": 6,\n      \"UNKNOWN\": 0,\n      \"PENDING\": 0\n    },\n    \"unhandled_state_counts\": {\n      \"WARN\": 0,\n      \"CRIT\": 6,\n      \"UNKNOWN\": 0\n    }\n  }\n}"
  }
]
Thought for 3.6 seconds
The monitoring overview shows there are 25 hosts and 408 services, but it doesn’t give me specific host names. I need to find the CO2 device specifically. Let me try to get hosts with “CO2” in their name. Since the API requires exact matches, I’ll need to try different common naming patterns.
Let me try searching for hosts that might be named “co2-device”, “co2-sensor”, or similar. Actually, let me first try to get all hosts to see what’s available, but that might be too much data.
Actually, a better approach would be to try some common naming patterns. Let me try “co2” as a host name first, and if that doesn’t work, I’ll try other variations.
Wait, looking at the get_hosts function again, host_name can be an array of exact host names. So I could try multiple common patterns at once. But that might still not work if the naming convention is different.
Let me try a different approach - let me search for hosts with “co2” in their name by trying some common variations. I’ll start with just “co2” as a simple test.
To shorten this a little bit - the llm find the host “CO2” sees that it is up.
Thought after state is up found
Perfect! I found the CO2 device. It’s in the UP state. Let me also check if there are any services on this host to provide a more complete status. Let me get the services for the CO2 host.
Tool call - get_services
Thought after service result fetched
Great! Now I have a complete picture of the CO2 device status. Let me summarize this information for the user.
Key findings:
- Host “CO2” is in UP state
- Most services are OK, but there are 2 CRITICAL services:
- “CO2 board co2” - showing 1235 ppm (critical threshold at 1200 ppm)
- “CO2 level (ppm)” - showing CO2/ventilation control with Watterott CO2-Ampel, Co 2 ppm: 1235.00 (critical at 1200 ppm)
Both of these are measuring the same thing - the CO2 concentration is at 1235 ppm, which exceeds the critical threshold of 1200 ppm. This is a concerning situation that needs attention.
Let me provide a clear summary to the user.
Result of question to LLM.
Your CO2 device is currently online and monitored, but there’s an urgent issue with the CO2 concentration levels!
Current Status Summary
Host: CO2
- State:
 UP (online)
- Last check: 2026-10-10T08:12:03+00:00
- Acknowledged: No
- In downtime: No
 Critical Alert - CO2 Levels!
Two services are in CRITICAL state:
-
CO2 board co2: 1235 ppm 
- Warning threshold: 1000 ppm
- Critical threshold: 1200 ppm
- Last OK: 2026-10-10T05:30:30+00:00 (about 3 hours ago)
-
CO2 level (ppm): 1235.00 ppm
- Warning threshold: 1000 ppm
- Critical threshold: 1200 ppm
- Last OK: 2026-10-10T05:30:30+00:00 (about 3 hours ago)
Other Sensors (All OK )
- Pressure: 960.2 hPa
- Lighting: 152 lux
- Temperature 1: 19.9°C
- Temperature 2: 24.4°C
- Humidity: 48.8%
Recommendation
The CO2 level has exceeded the critical threshold (1200 ppm) and is currently at 1235 ppm. This indicates poor ventilation in the room. You should:
- Open windows/doors to improve airflow
- Activate any ventilation systems
- Consider the Watterott CO2-Ampel for automatic control
The high CO2 level has persisted for approximately 3 hours without improvement.
Conclusion - for a 9B model not bad
With more general questions like “What device inside my environment had yesterday the highest memory usage?” you get no good result. Most times your LLM is stuck in a loop there.