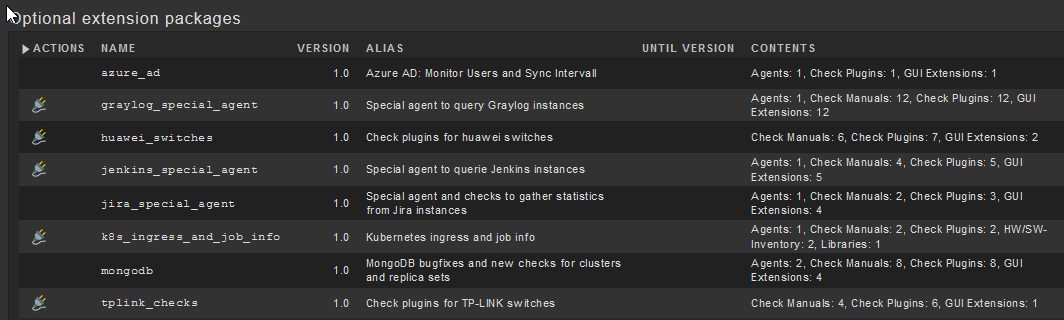
As we finalize the next Checkmk version, we are excited to announce the next step along the way: Feature Pack 2. Just like in the previous feature pack, the new features are delivered as MKPs that you can choose to activate. In the Enterprise Edition, this is easily done via WATO. Users of the Raw Edition can activate the features included in the feature pack via the CLI. We have written a detailed blog post here.
What’s in Feature Pack 2?
Prometheus Integration
Checkmk users who also use Prometheus can integrate it into their Checkmk from version 1.6.0.p12. We provide integrations for the most important exporters of Prometheus. The supported exporters are cAdvisor (Container Advisor), node_exporter and kube-state-metrics. It is also possible to include metrics from Prometheus via PromQL queries.
Redis Monitoring
Monitor Redis databases and instances. For the monitoring you need the agent plugin mk_redis , which can be configured with the Agent Bakery via the rule Redis databases . The plug-ins provide, for example, information on the persistence status of Redis instances and on the currently connected clients.
RabbitMQ Monitoring
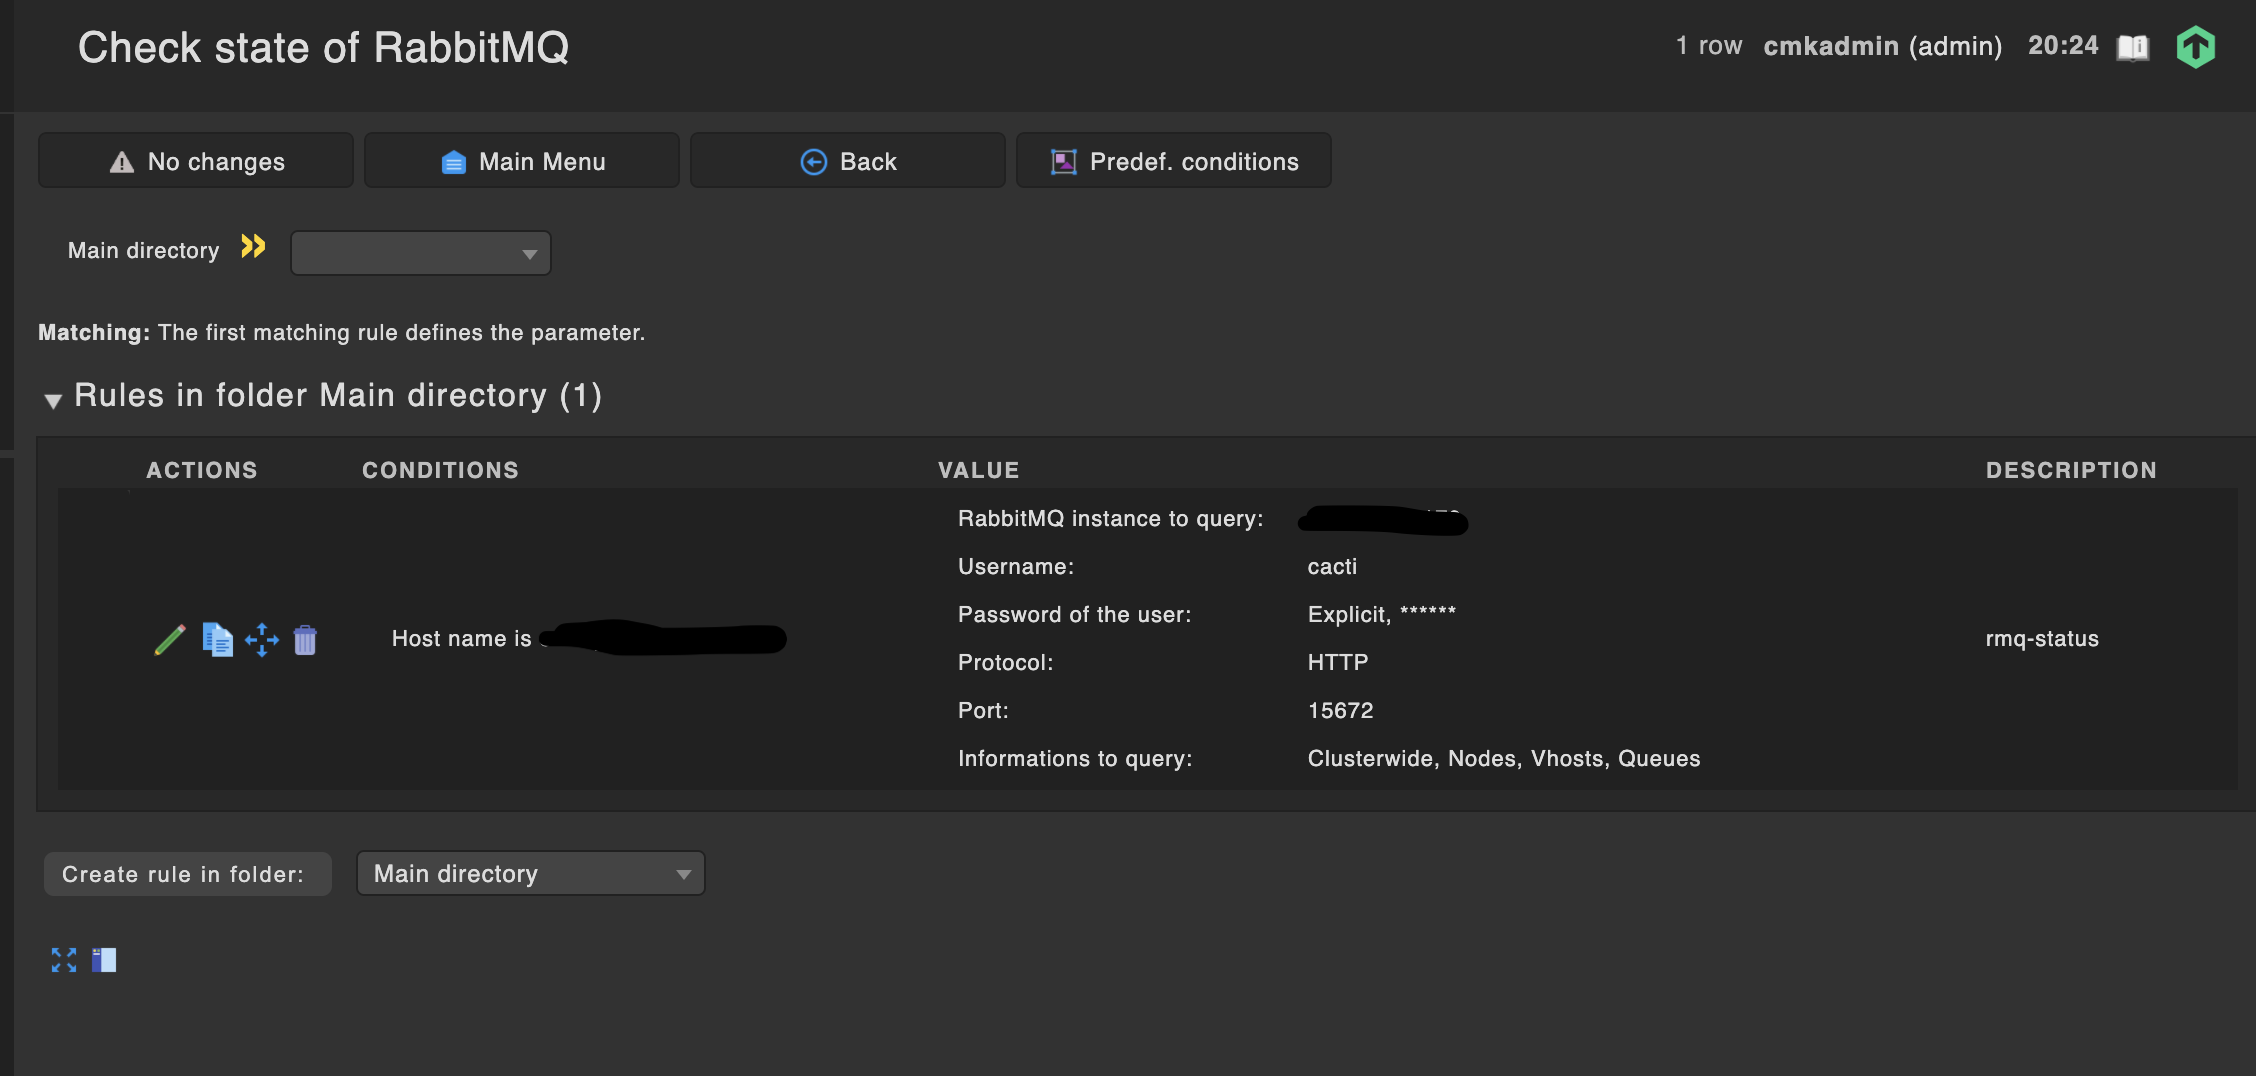
It is now also possible for you to monitor RabbitMQ clusters with Checkmk. All you have to do is to configure the Special Agent via the Datasource rule Check state of RabbitMQ to monitor queue and vhost statistics, either cluster-wide or specifically on a node.
FortiGate VPN-Monitoring
It’s now possible to configure the monitoring for each of the active VPN tunnels.
Pulse Secure Monitoring
Monitor the number of users, CPU, memory and disk usage, temperature and log file usage on Pulse Secure appliances.
Cisco ASA Monitoring
Two new check plug-ins to monitor the number of active WebVPN and IPsec sessions for Cisco ASA devices.
Cisco Webex Team Integration
The extension allows you to inform operations teams about changes in the status of hosts and services via Cisco Webex Team.
So to get this with Enterprise, do I need to update to the latest patch revision? Or should it “just show up” in my extension packages? Currently running 1.6.0p9.
As we have some RabbitMQ instances in our environment, I am interested if there is added value of this plugin.
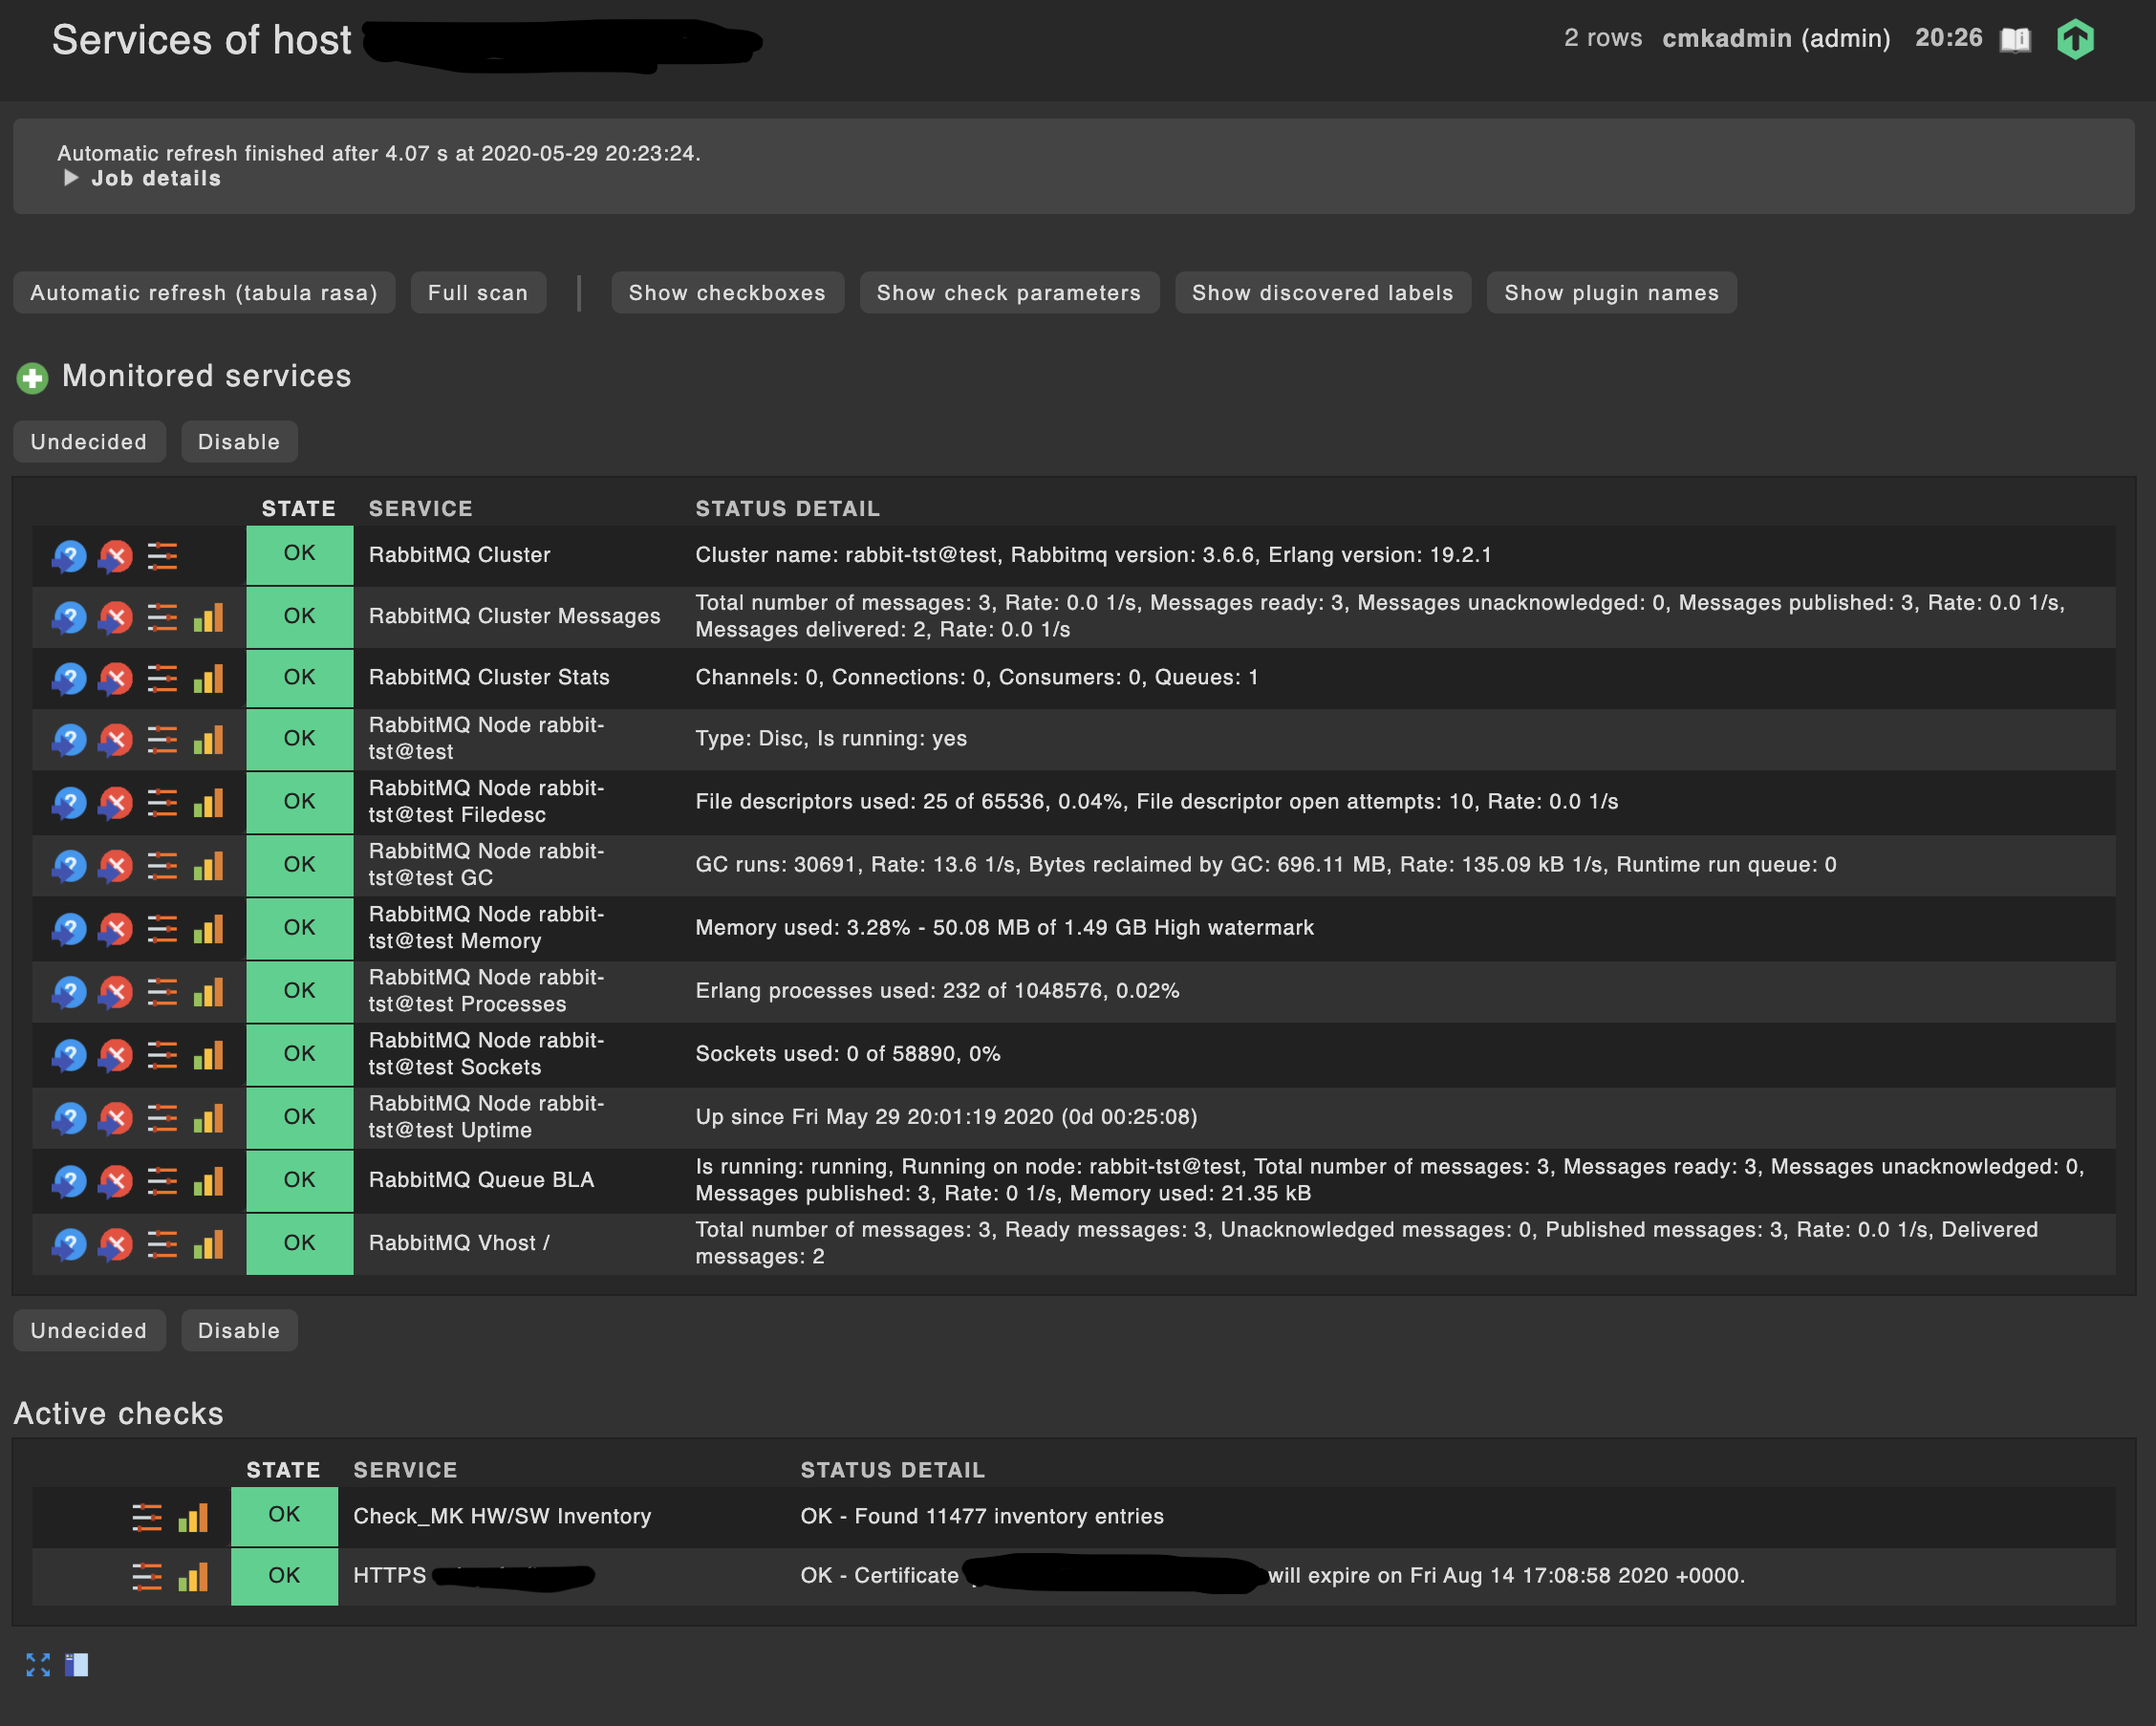
I observed a strange behaviour after enabling the RabbitMQ plugin on 1.6.0p12 CRE on Debian 10 (Buster) :
installed the ‘/opt/omd/versions/1.6.0p12.cre/share/check_mk/optional_packages/agent_rabbitmq-1.0.mkp’ plugin
enabled the datasource program for ’ Check state of RabbitMQ’
bind this rule to a specific host
After a ‘Full scan’ of this specific host, the new RabbitMQ services do appear, however the other regular services (ie. CPU, memory, IO, …) disappear…
When disabling the datasource program, the regular services appear again…
See attached some screenshots.
Are there some more steps required to have this working correctly?
I think you took the wrong datasource for the host. If you want checkmk agent output and datasource output, choose “Normal Checkmk agent, all configured special agents” in WATO configuration of the host.
Team, I have added the Prometheus in the kubernetes cluster. I can addPromQL and I can add individual metrics. Is there any way all the metrics can be added automatically like in case of special agent scenario.
Also can you please let me know if the following exporters can be added all at once or only one should be added.
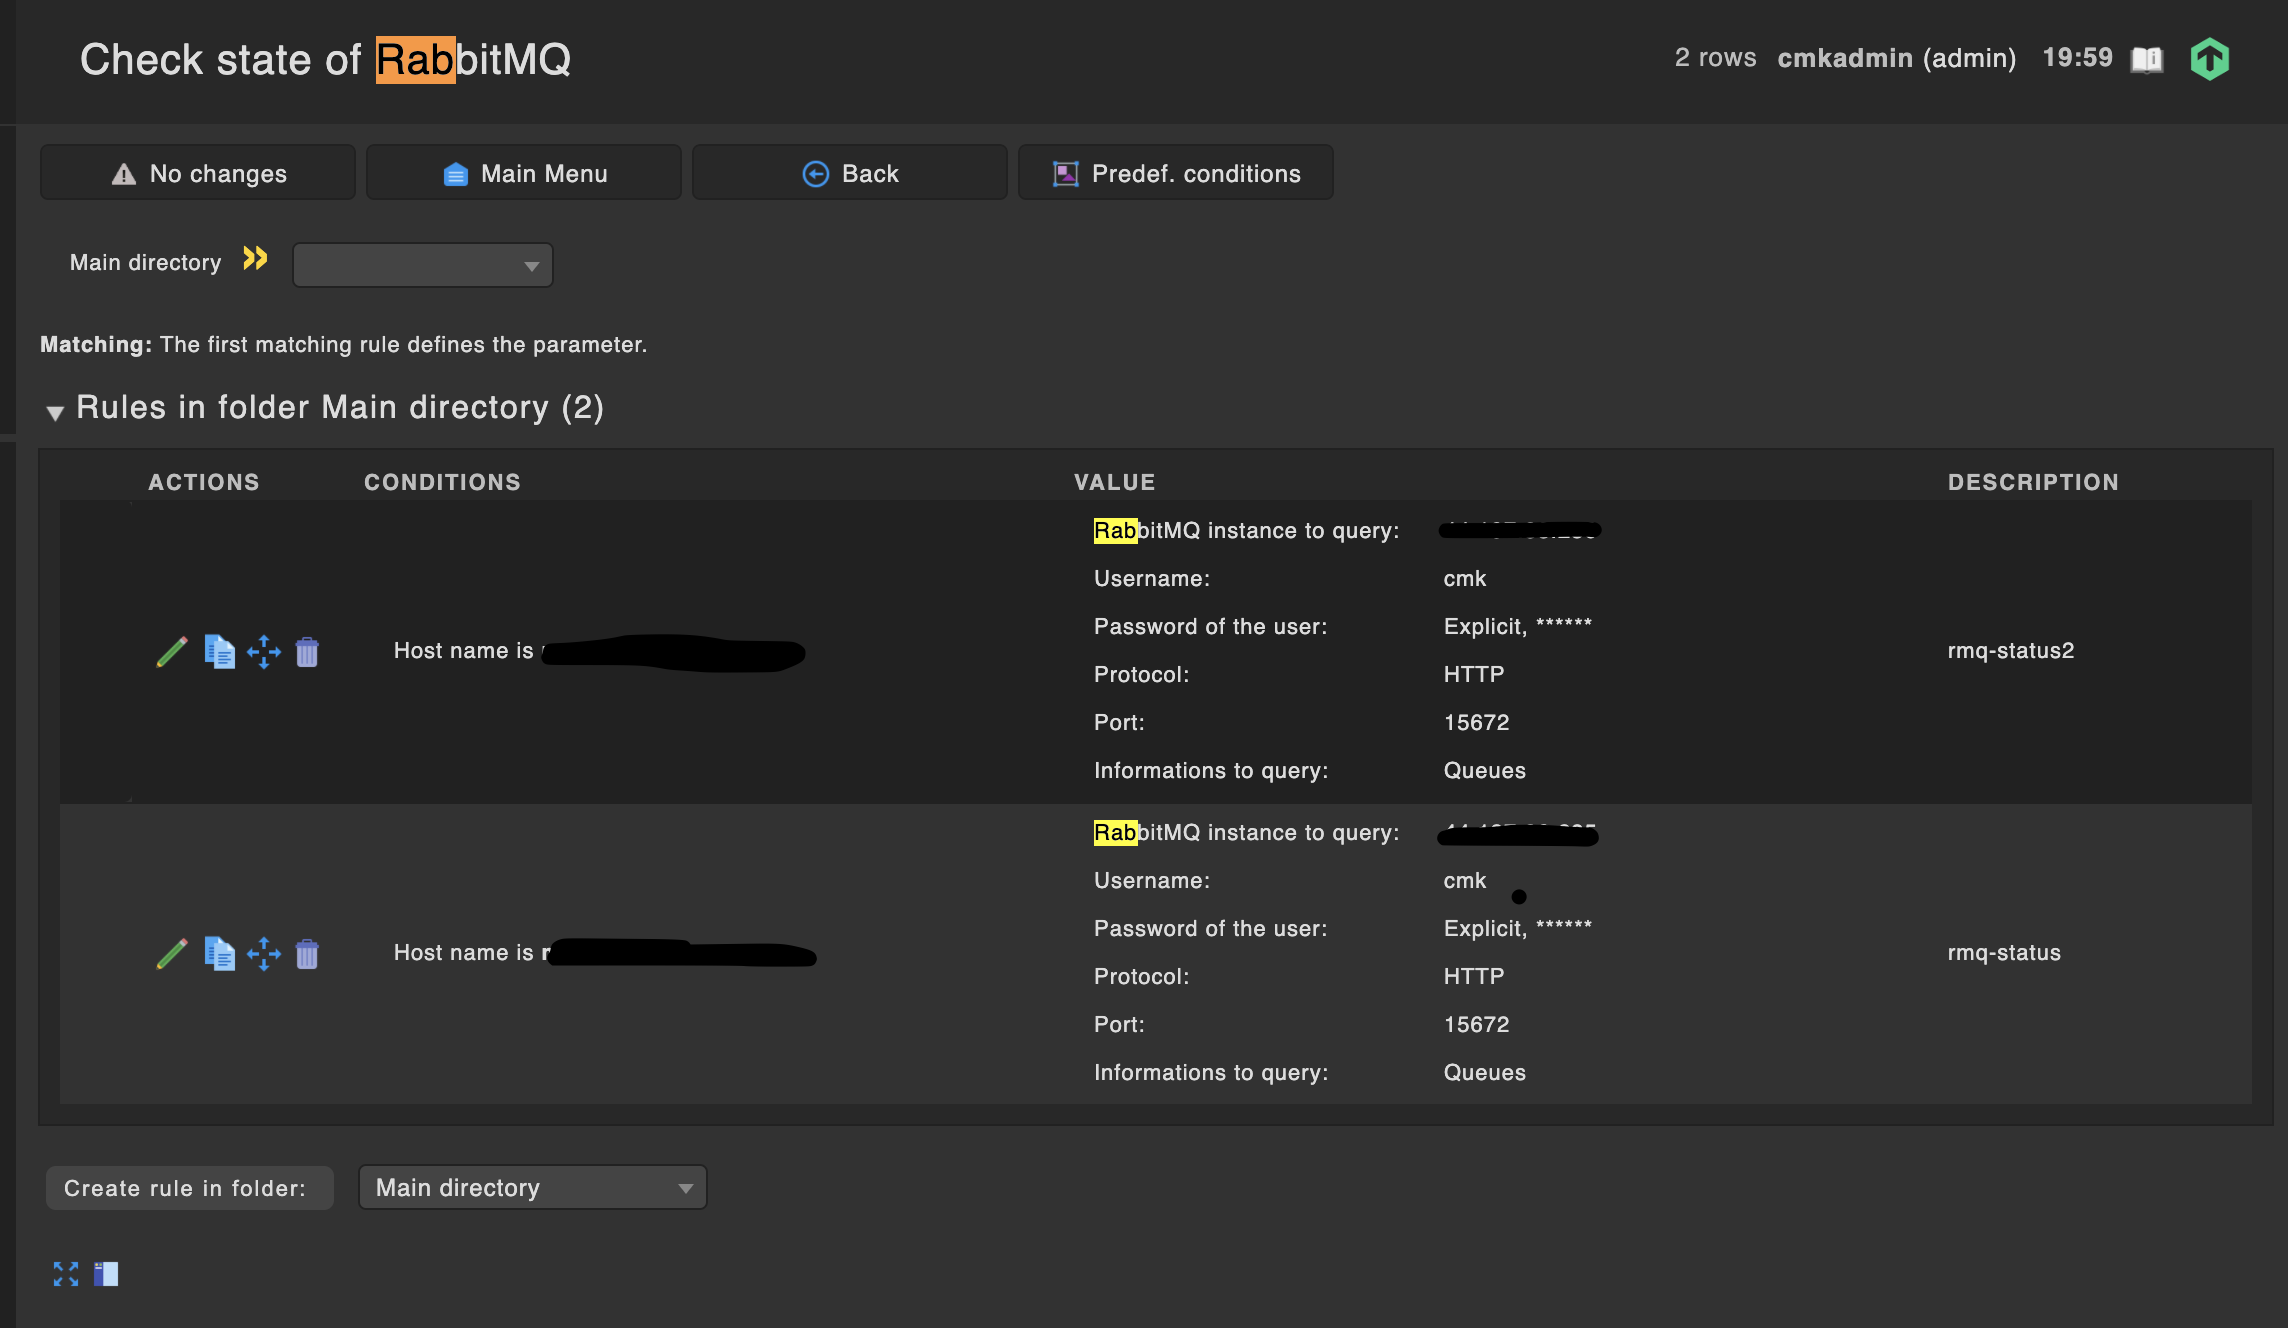
Today I attempted to add a second RabbitMQ host to our monitoring server via the above described procedure, but I believe I found a bug when there is more than 1 server defined.
I attempted this on 2 completely different CRE1.6.0p17 installations, with the same result.
Ways to reproduce:
create one Datasource Program ‘check state of RabbitMQ’
the config is pointing to a remote server with username/password
only ‘Queues’ are queried
an explicit host is configured from where the queries are initiated
This should result in a new service when the explicit host is ‘polled’, which it does in my case.
Now repeating the above with another (second) host in ‘Datasource Program’ results does not result in new services. See screenshot.
When the order of the hosts is shifted, the result is also reversed. The earlier discovered service will go into unknown state.
Can anybody confirm this behaviour before opening a bug ticket?

 will keep in that in mind next time