Hello All,
Please let me know procedure to fetch existing thresholds per service.
Thanks in Advance.
Regards,
DD
Hello All,
Please let me know procedure to fetch existing thresholds per service.
Thanks in Advance.
Regards,
DD
Hi Dinesh,
what do mean with fetch ?
Via Rest API for single Services or as a documentation to document thresholds of the ruleset ?
Hello @aeckstein,
Thanks for replying.
I have multiple hosts and applied multiple ruleset for threshold.
I want list of services with its threshold currently applied.
Example :
Host A : CPU Utilization : warning 80%, Critical 90%
Host A : Memory : Warning 80%, Critical 90%
Host B : CPU Utilization : warning 85%, Critical 95%
Host B : Memory : Warning 90%, Critical 95%
Regards,
Dinesh
Dinesh,
this is not build in into checkmk.
@r.sander wrote a helper script to export all rulesets into csv file, but that includes all rules with parameters and conditions, not the exact threshold per host.
If it is possible to read every host with its effective parameters with the rest api, I could think about programming that, as i have a customer who needs exactly that, but I have not yet looked into it.
Yes, basically you would have to recreate the activation process to compute all the thresholds from the rules for all hosts and services.
The export script is here: check_mk_extensions/helper/bin/showrules.py at cmk2.2 · HeinleinSupport/check_mk_extensions · GitHub
It needs our API wrapper: check_mk_extensions/check_mk_api at cmk2.2 · HeinleinSupport/check_mk_extensions · GitHub
Currently I have a script that pipes the output of cmk -D in the cli into a text file, but that is more than an ugly workaround and far away from a nice documentation 
But that might also be a workaround or a solution, depending on the expectation on the documentation.
This is something we are missing even since nagios times. In nagios we had to look in to the configuration auf each service. In checkmk you may see the levels in the service performance data if they are static. It doesnt work if options like ‘Averaging for total CPU utilization’ for CPU or predictive levels is used as we use for CPU load. We discussed this with checkmk experts and theer is no way to extract because the levels are calculated dynamically by the core.
We are in the luxury situation that our monitoring users accept templates and we are able to have one rule for levels for a certain host type (Windows, Linux etc.) and no individual levels per host.
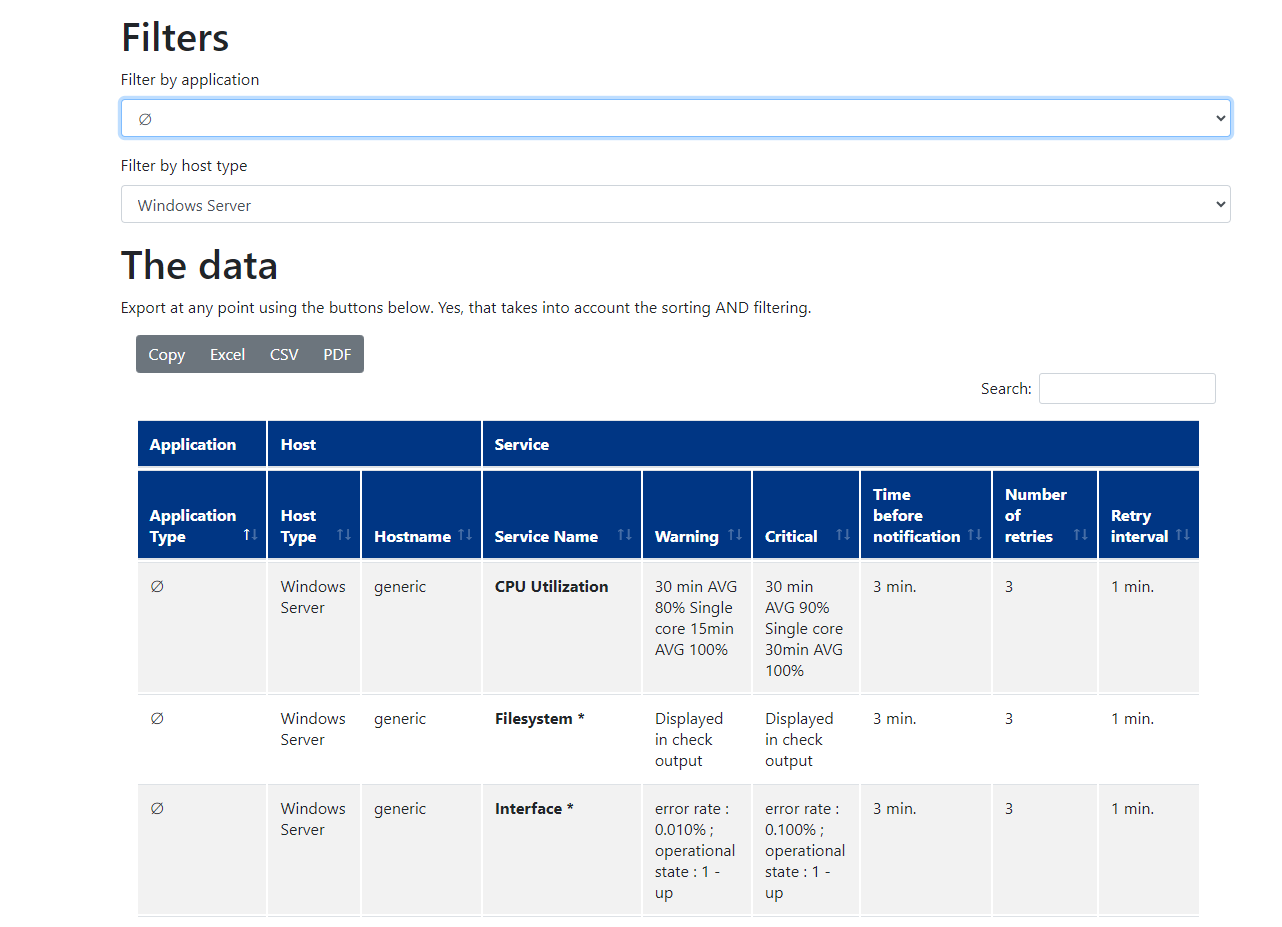
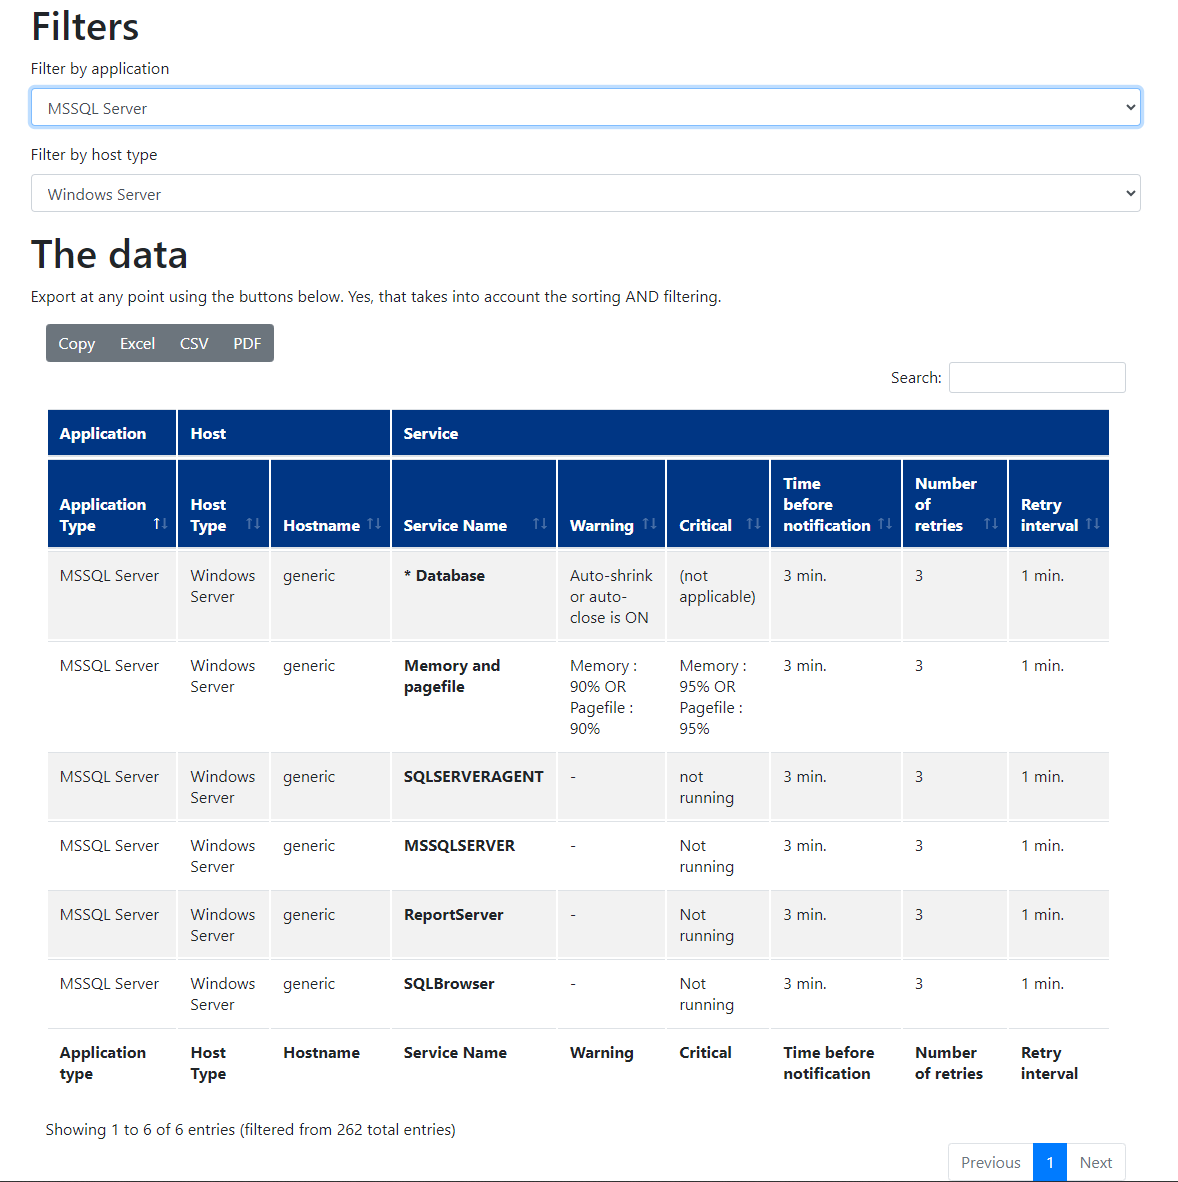
For documentation purpose we build a small web application with help of Django:
This topic was automatically closed 365 days after the last reply. New replies are no longer allowed. Contact an admin if you think this should be re-opened.