New MKP from thl-cmk is now also available on the Checkmk Exchange including the binaries of logpresso (approved by the maintainer).
Old one has been deprecated and files are removed.
Thanks @thl-cmk
3 Likes
You’re welcome. THX to all who helped to make this work. Especially to @Doc and @martin.hirschvogel.
5 Likes
Idea
Solution
1 Like
das hatte mit der laufzeit der scripte gar nichts zu tun. der scan wurde nicht gestartet. der agent verlor sofort mit kopieren der ps1 seine verbindung und war nicht mehr erreichbar.
I tested the plugin today (Linux). It does not work when put under a timer e.g. 86400. It started working when I moved the file out of there but then obv crashes for a few seconds every time because it runs so often, so I removed the plugin for now. The rulings for the warnings are also not working correctly.
The rulings for the warnings are also not working correctly.
What exactly is not working? Can you be a little bit more specific?
It does not work when put under a timer e.g. 86400.
Have you Read the “How To” and worked through the “If it doesn’t work” section? What is the outcomming?
Yes I have, it runs fine when I manually run the script on the server. On checkmk it shows 10 vulnerable files but on the server it shows 0.
But on checkmk setting a timer does not work so it keeps crashing the connection to the agent each time it runs.
I used it via bakery/automatic updates because I have the enterprise edition
he is right.
when configuring the service you need to set warn levels for
Files vulnerable:
Files potential vulnerable:
Files mitigated:
Files scanned:
Directories scanned:
Run time:
Empty fields are not allowed and if you dont set leven, then you wont see the output in the service desc line. You then have to drop down into the service to see all numbers.
BUT…
if you set warn/crit levels like 0/0 or 1/0 like in the example I saw somewhere in a how to, then this will always throw a warning or critical issue. Because “0” is not NULL.
Same for scanned files and folders. You need to set a warn level, else the result wont show in the service line. Just like here (I disabled the warning/critical for folders and files, so you cant see those numbers)
++++und jetzt nochmal auf gut deutsch++++
möchte man in der kompakten darstellung aller services eines hosts ergebnisse zu log4j sehen, so muss man die warn-level für den log4j cve… service konfigurieren.
macht man das nicht, sprich nimmt die checkbox für diese alarmierung ganz raus, so taucht die zahl auch nicht auf. man muss erst in den service tiefer einsteigen um ein listing der ergebnisse zu bekommen.
aktiviert man aber die alarmierungen zb für files und folders, so kann man dort nicht einfach “0” eintragen, sondern muss, damit das nicht staendig auf critical laeuft eine unbrauchbar hohe zahl eintragen. das mag bei files und folders ok sein. zum problem wirds aber bei “mitigated”.
in einem beispiel das ich irgendwo hier gefunden habe, war aufgezeigt wie man die alarmierung durch konfiguriert. dort stand für “mitigated” warn 1 und crit 0.
Das führt aber dazu, dass dieser check IMMER als critical zurückkommt, weil 0 critical dann eben immer zutrifft wenn nichts kritisches gefunden wurde.
im falle für files und folders ist das aehnlich “0” eintragen geht nicht, weil die anzahl immer >0 ist. leer lassen geht auch nicht, weil dass die gui nicht zulaesst. also muss man irgendeine sehr hohe zahl eintragen die nie erreicht wird
1 Like
@AdminStuff/@mixtape can you please post the raw output from one of the affected systems so I might have a chance to see whats wrong?
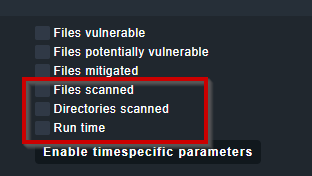
If you don’t tick this boxes then there is no Warn/Crit for these values. (Default ins None/None)
For Files vulnerable/potentially vulnerable there is a default of 1/1 Warn/Crit → always Crit if even one file found
For Mitigated the default is 1/None → Warn if at least on file found
@mixtape/@AdminStuff BTW. what default’s do you like to have?
1 Like
but if you dont tick, you cant see those as results in the service overview of the host
→
(The runtime is shown because i activated and set levels for warning and critical)
It would be good to see the resulting values without setting any alarm levels.
2 Likes
This is right, So you want the number of scanned files/directories show up in the short output?
1 Like
exactly  as its also a good indicator if the output is legit.
Hm, i am not realy convinced, but maybe i make it configurable. For now you can change this in the check plugin ~/local/lib/check_mk/base/plugins/agent_based/cve_2021_44228_log4j.py:
161     for value, levels_upper, label, metric, notice_only in [
162         (section.files_vulnerable, params['files_vulnerable'], 'Files vulnerable', 'files_vulnerable', False),
163         (section.files_potential_vulnerable, params['files_potential_vulnerable'], 'Files potential vulnerable', 'files_potential_vulnerable', False),
164         (section.files_mitigated, params['files_mitigated'], 'Files mitigated', 'files_mitigated', True),
165         (section.files_scanned, params['files_scanned'], 'Files scanned', 'files_scanned', True),
166         (section.directories_scanned, params['directories_scanned'], 'Directories scanned', 'directories_scanned', True),
167     ]:
Set the last value to “False” for the items you want to show up in the short output.
i give up… what a headfuck to get it running…
- files in folders where they shoul be
- check_mk.user.yaml edit like it should
- plugin tested on powershell - works
- wato rule done
but: no output in gui, nothing…
I guess you are using the raw edition wit windows?
What WATO rule, there is no need for a WATO rule on the raw edition to get it running.
Is there any output from the plugin when you run "cmk -d ?
Hello everyone,
Anyone thought about what to do with containers that might have vulnerable files inside
them? Would one simply set up e.g. /var/lib/docker or similar as DESTPATH? Has
anyone tried that, or shall I “take the fall” ?
Thomas
You could have a look in the /var/lib/check_mk_agent/cache/ folder.
While a scan is running you could see here cve.new files where you can possibly see the output from the scan. I’ve got also some problems with long scan times. I try to exclude filesystem types and/or folders.
Also have a look at ps aux | grep scan if there is a scan process running and blocking another one. Kill it via kill -9 PID.
Do not start with all parameters activated. Start with a single drive for the scan, not all drives and not all options.
Also keep the ressources of the monitored host in mind. i.e. we have a developement server with 2 cpus and mssql installed and an incident like “we can not work anymore” → this host has a cpu load og avg. 90% over the last 6 months and the log4j2-scan uses a complete cpu-core. This will definitely fail.
And I also have problems with caching. The run of the plugin on the shell runs fine, buit I never see a service in the discovery. These hosts are frustrating.
Conclusion: You are not alone. Keep going!
2 Likes
I use docker-binds in the local volume. They will be scanned.
Thanks @Doc,
Indeed that is an idea. Not sure what our developers do, because I believe they use
a lot of “ephemeral” containers that don’t use a bound local volume, but I’ll check.
Similar problem will arise with pods.
Thomas
1 Like