Getting the plugin names and service item of services via livestatus query

Hello,

is there a way to get this column but via livestatus query?

I have been trying to find the right columns with:

lq "GET columns\nFilter: table = services\nColumns: name description"

But I couldn’t really find anything plugin related expect the plugin_output which is not what I am looking for.

Something like this?

lq "GET services\nColumns: check_command\nFilter: host_name = servername"

Where servername is name of your host.

1 Like

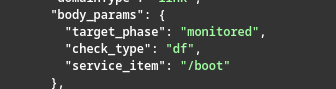
I guess I could just replace all the “check_mk-” at the beginning and then I would have it but do you also know how I could get the service_item from the service?

Like shown here with “/boot”
image

I see it is sometimes part of description or display_name, but I don’t know it as seperate entity.

1 Like

AFAIK - the item is not part of any livestatus column (or I missed it), when we needed the item specifically, we greped it from the ~/var/check_mk/autochecks/ files, but that was before 2.2 (or maybe 2.1) and now you have a rest-api feature:

https://<url>/check_mk/api/1.0/objects/service_discovery/[hostname]

the response will include blocks like this:

      "df-/boot": {
        "id": "Filesystem /boot",
        "memberType": "property",
        "value": "monitored",
        "format": "string",
        "title": "The service is currently 'monitored'",
        "links": [
          {
            "rel": "urn:com.checkmk:rels/service.move-monitored",
            "href": "https://<url>/check_mk/api/1.0/objects/host/localhost/actions/update_discovery_phase/invoke",
            "method": "PUT",
            "type": "application/json",
            "domainType": "link",
            "body_params": {
              "target_phase": "monitored",
              "check_type": "df",                       # <---------
              "service_item": "/boot"                   # <--------- I think you're looking for these
            },
            "title": "Move the service to monitored"
          },
1 Like

easy with the language :wink:

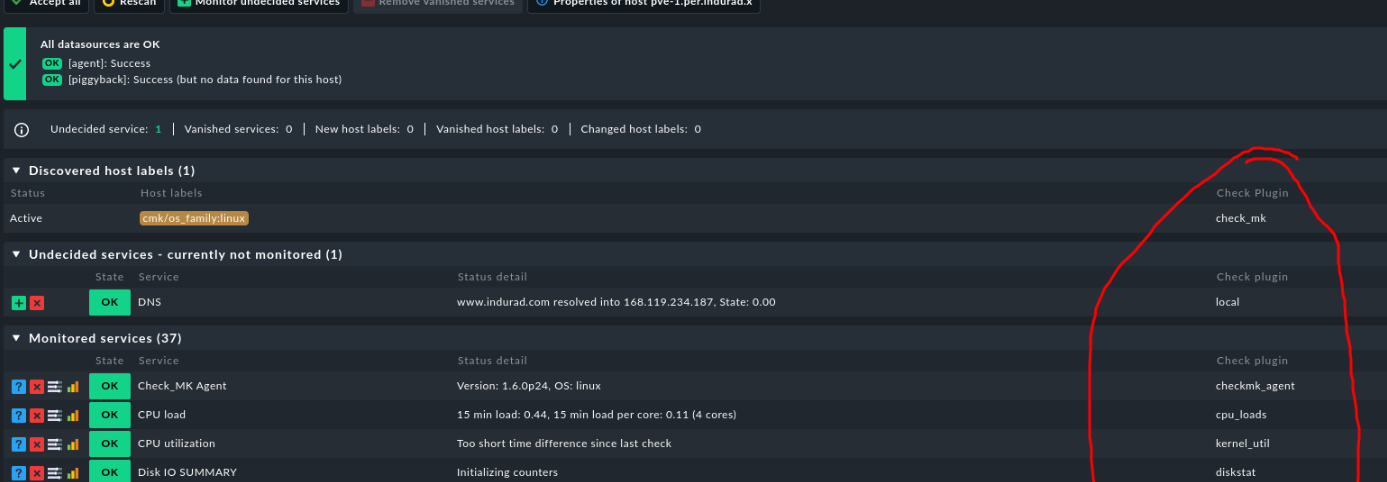
my example output was already from the objects/service_discovery call, unless you need additional information, why would you have to call “update the phase service” API call?

the service discovery call takes around 3-5 seconds per host… not super fast, but even with a hundred hosts, not something that adds up to hours that quickly.

If however, you find yourself in the need to use this info much quicker, again, you can manually parse the ~/var/check_mk/autochecks/* files - however, in a distributed environment, you’ll need to do that on each instance.

if you have a really tiny installation yes. we have millions of services and we use the API all the time, watch your language please!

another, easier option is to create a view that adds the service output just like you had in the service discovery. as you know you can output any view in python/json/csv and run this programmatically. here you can use all filters you have in views easily, for example filter by labels…

This topic was automatically closed 365 days after the last reply. New replies are no longer allowed. Contact an admin if you think this should be re-opened.