CMK version: Checkmk Enterprise Edition 2.2.0p9 with 3.1.1
Grafana v10.1.4 with cmk datasource
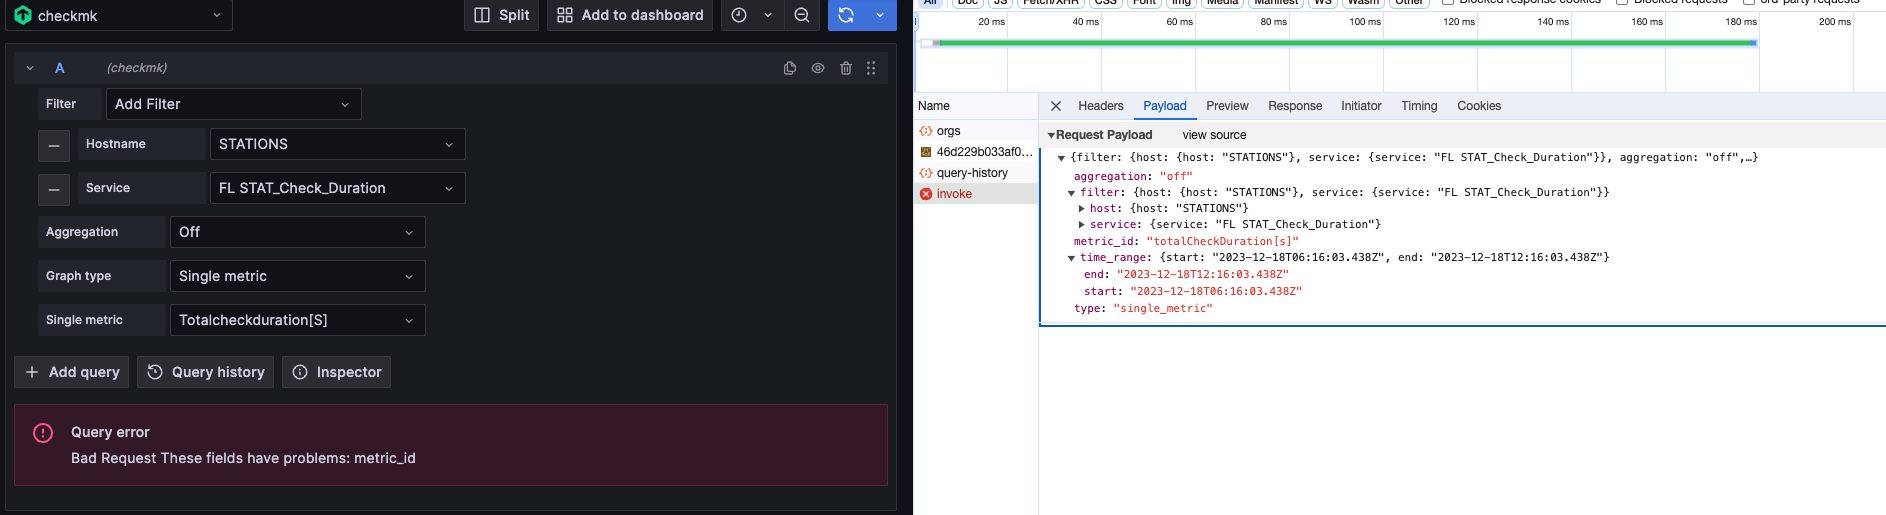
Using Grafana to visualise a few metrics from checkmk. This is mostly working well however for a specific “single metric” (output from a custom plugin) I always get the error in grafana
Query error
Bad Request These fields have problems: metric_id
Using a curl request i also see
{
    "title": "Bad Request",
    "status": 400,
    "detail": "These fields have problems: metric_id",
    "fields": {
        "metric_id": [
            "Missing data for required field."
        ]
    }
}
I fail to understand what “metric_id” is or how/where to set this. The graphing in cmk is working as expected.
In order to figure our what’s going wrong more information is needed: a screenshot of the query in grafana and the data/request that grafana sends to checkmk. (you can see this data either via network tab in developer tools of your browser, or via “inspect query” in grafana)