Hi Kony,
I think I have the same problem…
Grafana says that the database is working, but I don’t know what I have to put in on the dashboard to show a hosts data 
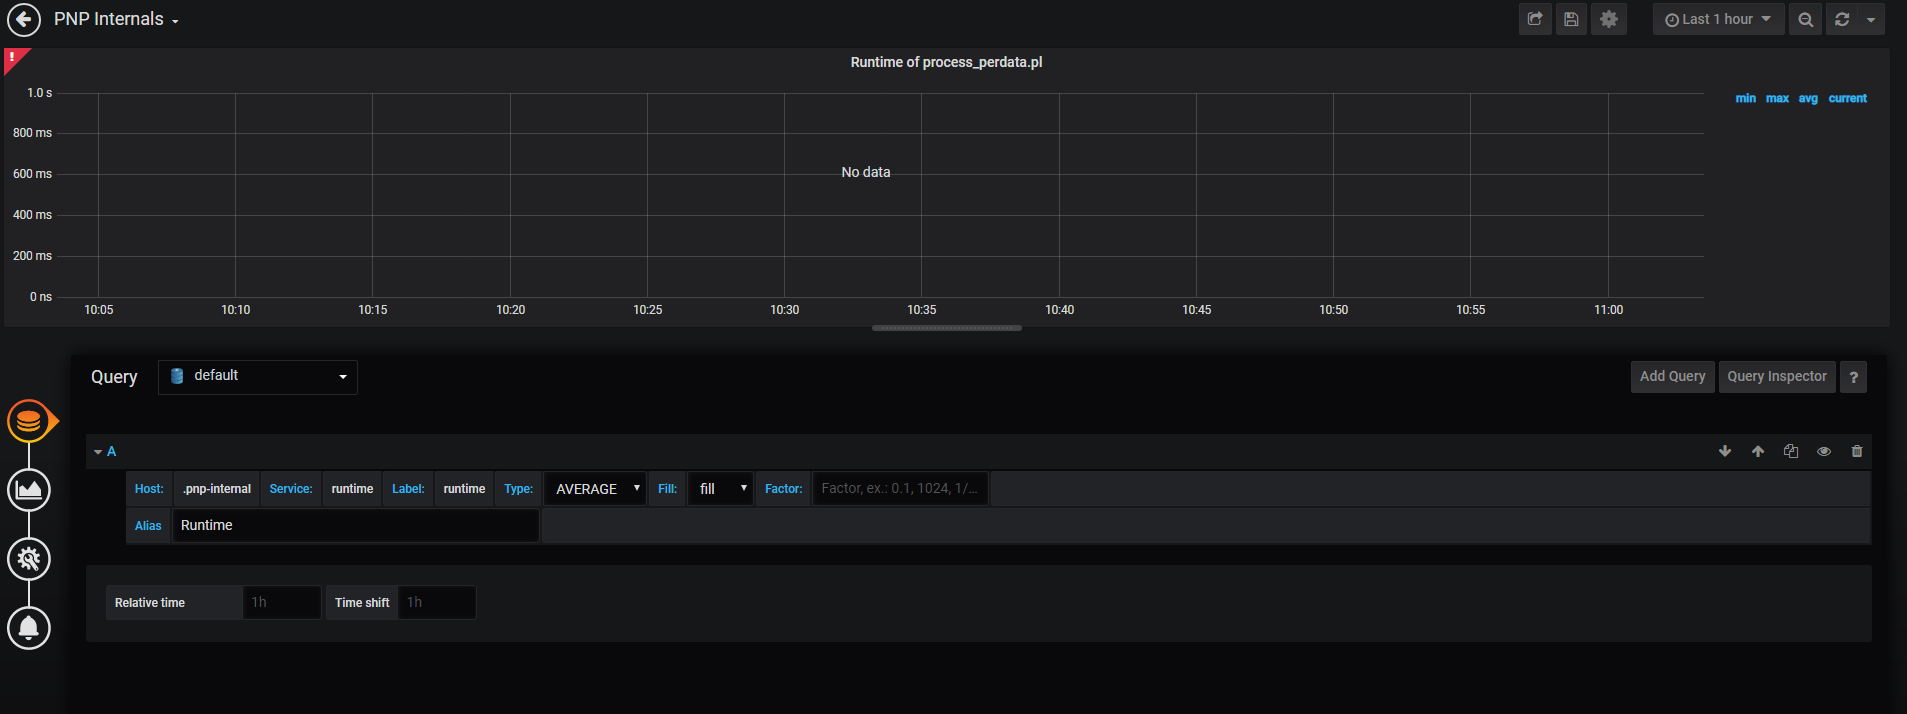
Neither .pnp-internal, localhost, nor a “normal” host works
Should the field be a dropdown or a normal textfield?