Hello,
we are trying to use Grafana for the creation of dashboards using our existing checkmk monitoring data (Checkmk raw 1.6.0p6). Following this article (https://support.nagios.com/kb/article/nagios-core-using-grafana-with-pnp4nagios-803.html#Grafana_Config) we configured the PNP datasource.
We are now able to see and select our different hosts, however no services are shown.
Has anyone successfully configured Grafana with the pnp plugin in combination with checkmk raw edition?
Or is there another way to make the monitoring data available for grafana dashboards?
I’ve spent a few days trying to get this to work and I ended up acquiring the CEE version and just connect Check_MK to InfluxDB and feed grafana via influx. Much cleaner and much easier to setup with close to no mainenance.
if you want to use grafana with RAW version, you have to install graphite, then grafana .
From grafana you can access the “db” from graphite and graphite get the data from Check_MK RAW.
No we are not using Influx db or graphite.
We fix this using below link.
Thanks for your support ![]()
1 Like
Hi Kony,
I think I have the same problem…
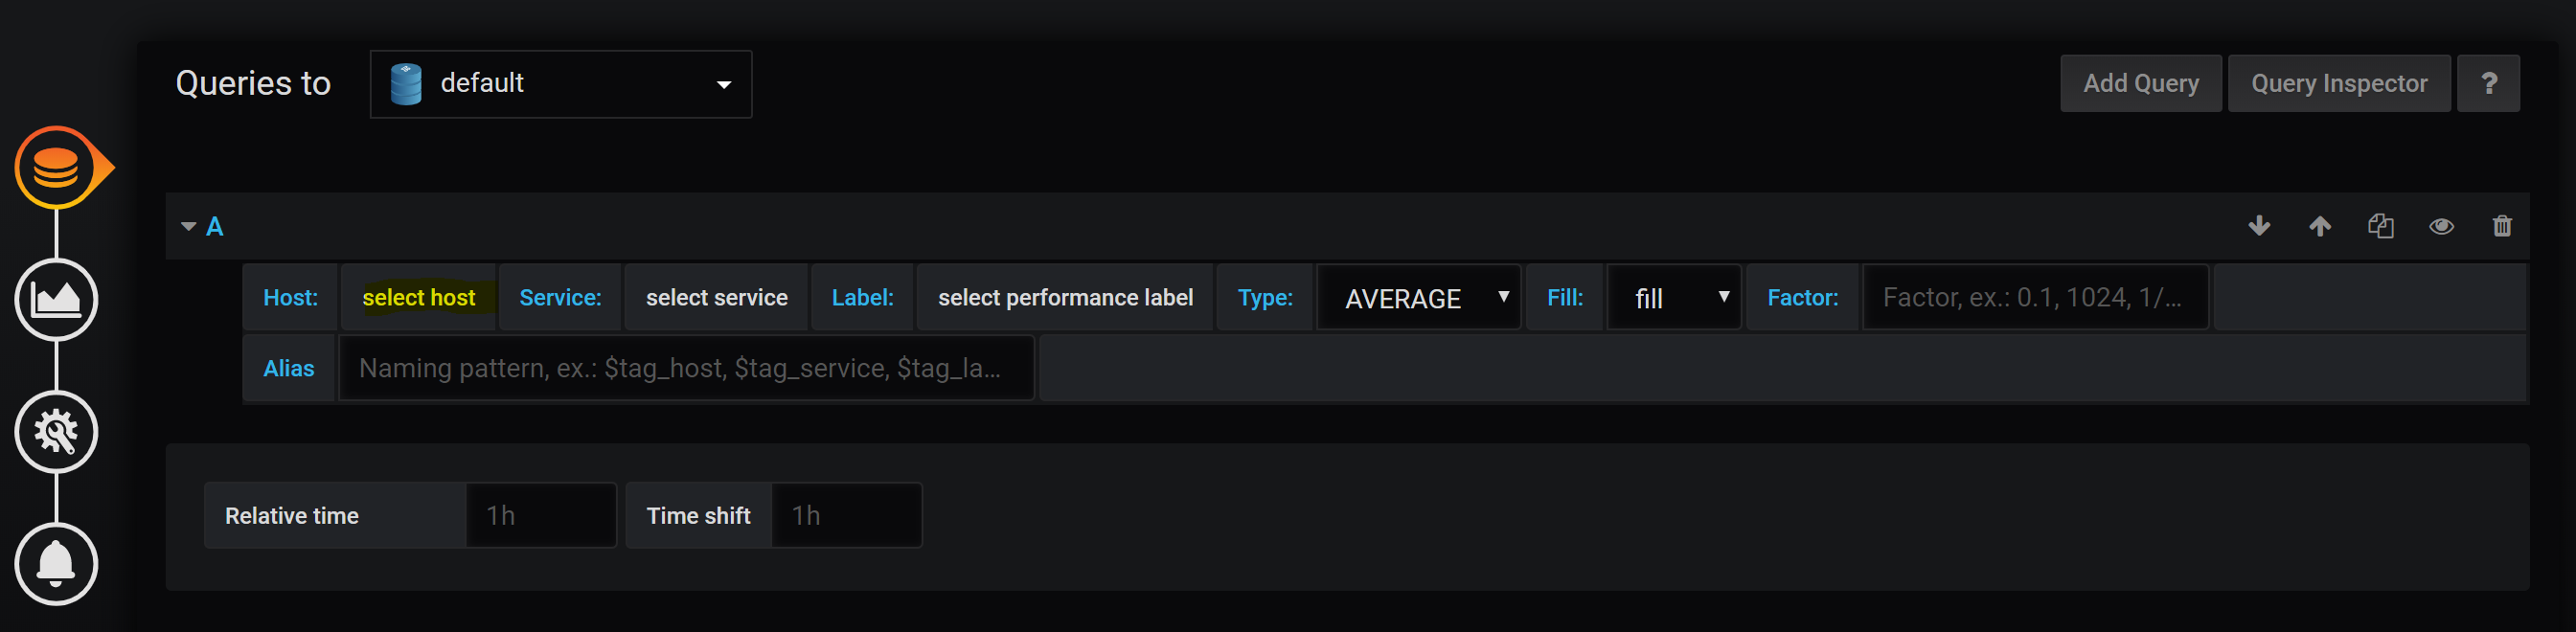
Grafana says that the database is working, but I don’t know what I have to put in on the dashboard to show a hosts data 
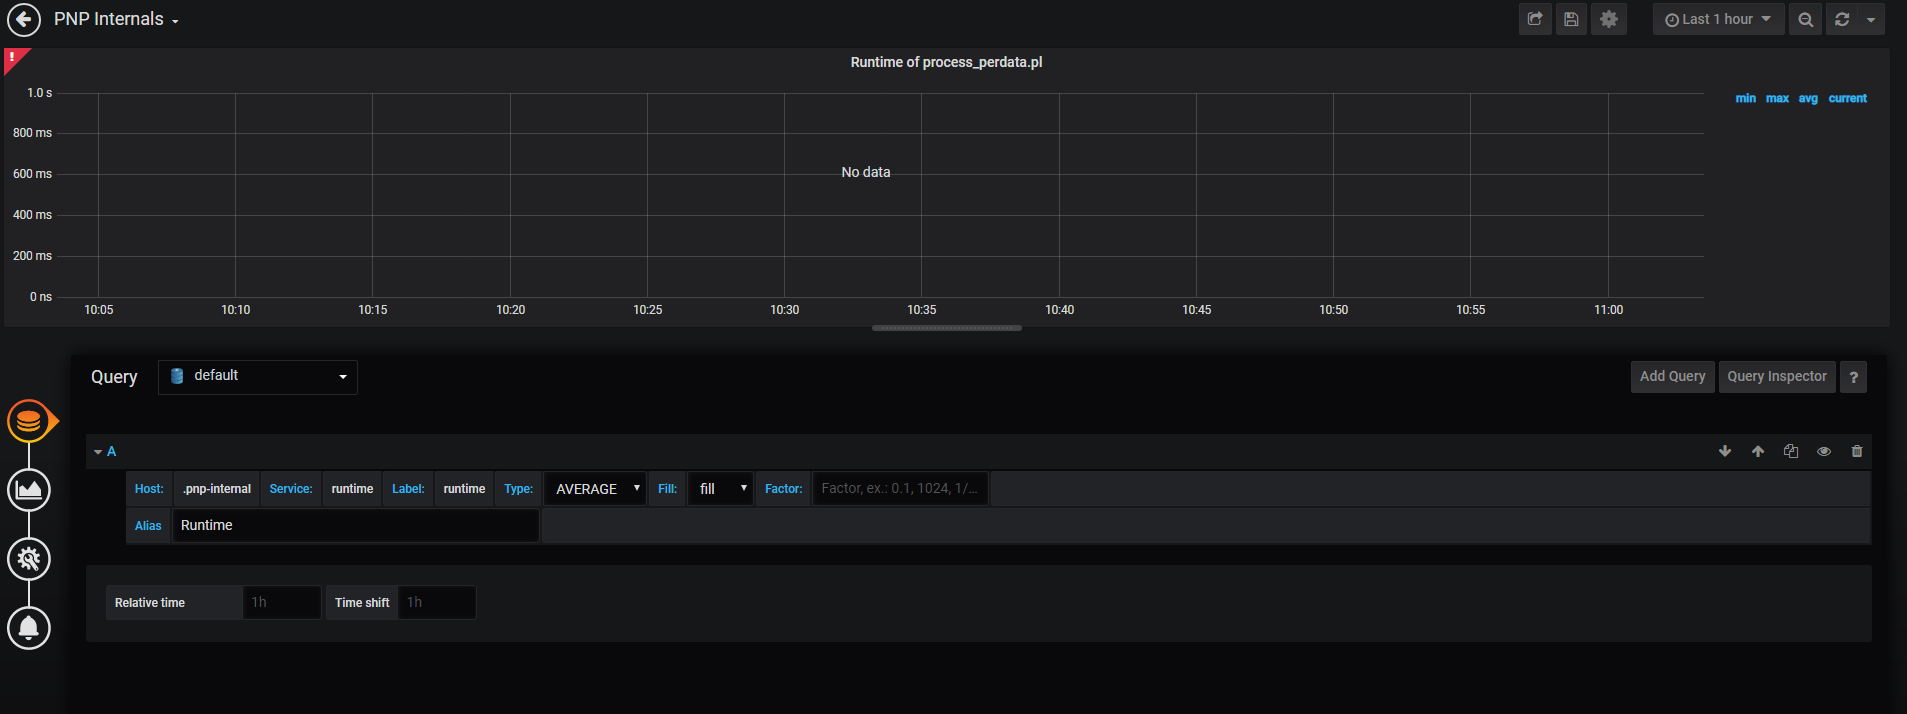
Neither .pnp-internal, localhost, nor a “normal” host works
Should the field be a dropdown or a normal textfield?
Hi Kanex, i think you have to check your data source settings for pnp in grafana.
I set it up like linked post from @KONY ([Check_mk (english)] Make Grafana with PNP plugin work with Check_MK CRE on one host) that works for me.
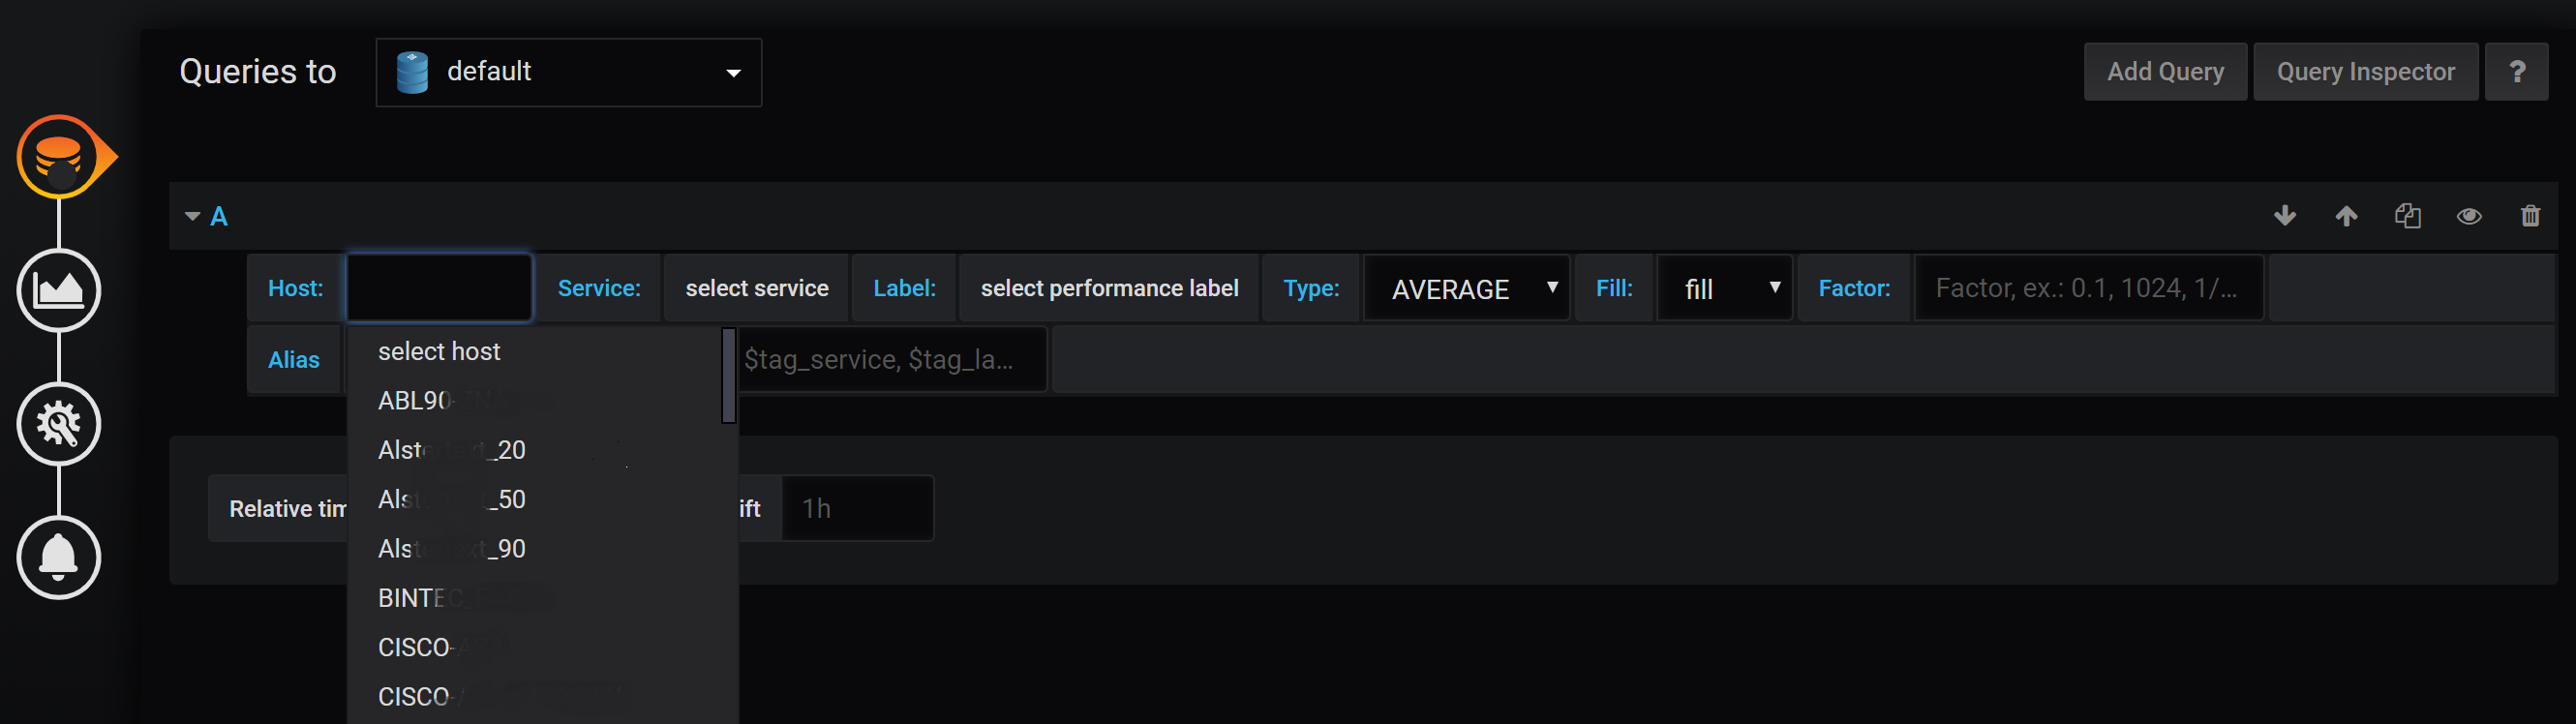
In case the connection works you only have to click on “select host” in query an you get a list of all your hosts you monioterd with checkmk. Hope it helps…

2 Likes
Hi @dns_es,
Thank you… It works.
I selected Access over “Browser” instead of “Server(default)” .
Thank you very much
Kanex
1 Like
Hi @Kanex,
perfect…
2 Likes
@Kanex and @dns_es
Can one of you tell us how do you start install Grafana? As I know only the CEE can export/send directly to Grafana…
Thank you both
In this case the CMK don’t sent any data to InfluxDB. Grafana will only query the pnp4nagios.
Inside the linked post above is described what you need to do, to access the graphing data from Grafana.
2 Likes
Hi @neeloj, like @andreas-doehler allready said it’s all readable inside the linked post. To answer your question how to install grafana? I´ve installed it via .deb package…
1 Like
thank you @andreas-doehler & @dns_es  you installed at same machine where Check_MK is installed ?
@neeloj in my case - yes
1 Like
thanks you so much @dns_es
1 Like
@neeloj your’e welcome…
1 Like
My grafana is not installed on same server where Check_MK is installed, and I use https on Check_MK server, how can I add my PNP with https`?
Hi @neeloj
IMO it should be doesn’t matter where grafana is installed. If you setup up all like the post before it should be only the config in pnp-datasource in grafana. I could test it tomorrow on a environment that seem’s like yours. I give you feedback afterbdoing that. Have a nice evening…
1 Like
thanks for your answer @dns_es, I installed on test environment all in one, check_mk and grafana like above post it works.
But when I want to access to the productive Check_MK which is available via https ( 443 ) it doesnt work like above article.
Thank you! You too ![]()
1 Like
Hi @neeloj,
sorry couldn´t test it today. Having trouble the whole day with our ISP. 
I´ll try it tommorow.
1 Like
@dns_es thank you, I tested some google articles but they doesn’t work for me :-(…