I am trying to create a small map in Grafana with canvas. The bandwidths between different locations should be displayed.
Unfortunately the metrics have the same name even if they come from different hosts. So I always have “Input Bandwith” and “Output Bandwith”. But in the metric field the name is only displayed once.
How can I change the metric name?
Is it possible that you are affected by #60? You have one graph, with multiple queries that query data from different hosts. The result is two metrics with the same name?
As far as i know there is currently no workaround.
It’s part of our internal roadmap. I would hope that we will fix this in 2023, but I can not make any promises.
ja das ist genau unser Problem was wir haben. Wir verwenden die Enterprise Version, es steht geschrieben da diese davon eigentlich nicht davon betroffen sind da man über regex suchen kann. Wie soll man das machen das der Metric Name nicht immer der gleiche ist?
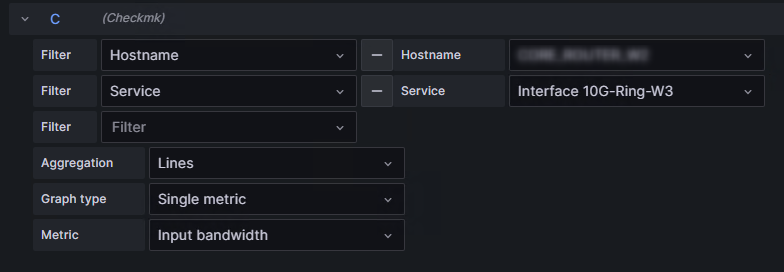
Instead of creating two different queries based on the Hostname Filter, (one for HostA and one for HostB) you create a single query using the Hostname Regex Filter for HostA|HostB.
btw: the screenshot shows an old version of the grafana plugin, you should probably update.
This topic was automatically closed 365 days after the last reply. New replies are no longer allowed. Contact an admin if you think this should be re-opened.