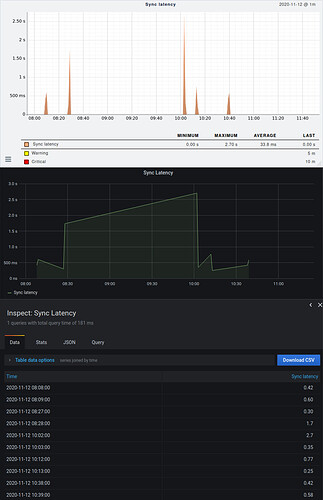
Hi Christian,
the data were certainly collected by CheckMK.
Grafana allows to inspect the CheckMK query. I extracted the query URL and put it in a script:
$ cat mysql_slave_sync_latency.sh
#!/bin/bash

# SERVER, USERNAME, SECRET
source SECURE.sh

DATA='request={"specification":["template",{"site":"Monitoring","host_name":"S21006","service_description":"MySQL DB Slave mysql","graph_index":1}],"data_range":{"time_range":[1605499383,1605520983]}}'
URL="https://$SERVER/Monitoring/check_mk/webapi.py?_username=$USERNAME&_secret=$SECRET&output_format=json&action=get_graph"

curl -X POST -d "$DATA" "$URL"
The output from the script looks like this
$ ./mysql_slave_sync_latency.sh
{“result”: {“step”: 60, “start_time”: 1605499380, “end_time”: 1605521040, “curves”: [{“color”: “#ffb080”, “title”: “Sync latency”, “line_type”: “area”, “rrddata”: [0, 0, 0, 0, 0, 0, 0, 0, 0, 0, 0, 0, 0, 0, 0, 0, 0, 0, 0, 0, 0, 0, 0, 0, 0, 0, 0, 0, 0, 0, 0, 0, 0, 0, 0, 0, 0, 0, 0, 0, 0, 0, 0, 0, 0, 0, 0, 0, 0, 0, 0, 0, 0, 0, 0, 0, 0, 0, 0, 0, 0, 0, 0, 0, 0, 0, 0, 0, 0, 0, 0, 0, 0, 0, 0, 0, 0, 0, 0, 0, 0, 0, 0, 0, 0, 0, 0, 0, 0, 0, 0, 0, 0, 0, 0, 0, 0, 0.283333, 0.733333, 0, 0, 0, 0, 0, 0, 0, 0, 0, 0, 0, 0, 0, 0, 0, 0, 0, 0, 0, 0, 0, 0, 0, 0, 0, 0, 0, 0, 0, 0, 0, 0, 0, 0, 0, 0, 0, 0, 0, 0, 0, 0, 0, 0, 0, 0, 0, 0, 0, 0, 0, 0, 0, 0, 0, 0, 0, 0, 0, 0, 0, 0, 0, 0, 0, 0, 0, 0, 0, 0, 0, 0, 0, 0, 0, 0, 0, 0, 0, 0, 0, 0, 0, 0, 0, 0, 0, 0, 0, 0, 0, 0, 0, 0, 0, 0, 0, 0, 0, 0, 0, 0, 0, 0, 0, 0, 0, 0, 0, 0, 0, 0, 0, 0, 0, 0, 0, 0, 0, 0, 0, 0, 0, 0, 0, 0, 0, 0, 0, 0, 0, 0, 0, 0, 0, 0, 0, 0, 0, 0, 0, 0, 0, 0, 0, 0, 0, 0, 0, 0, 0, 0, 0, 0, 0, 0, 0, 0, 0, 0, 0, 0, 0, 0, 0, 0, 0, 0, 0, 0, 0, 0, 0, 0, 0, 0, 0, 0, 0, 0, 0, 0, 0, 0, 0, 0, 0, 0, 0, 0, 0, 0, 0, 0, 0, 0, 0, 0, 0, 0, 0.9, 0.116667, 0, 0, 0, 0, 0, 0, 0, 0, 0, 0, 0, 0, 0, 0, 0, 0, 0, 0, 0, 0, 0, 0, 0, 0, 0, 0, 0, 0, 0, 0, 0, 0, 0, 0, 0, 0, 0, 0, 0, 0, 0, 0, 0, 0, 0, 0, 0, 0, 0, 0, 0, 0, 0, 0, 0, 0, 0, 0, 0, 0]}]}, “result_code”: 0}
Notice the long sequence of zeros and occasianally different values, like in this snippet:
0, 0, 0, 0, 0, 0, 0.283333, 0.733333, 0, 0, 0, 0, 0
So the zeros are definitely returned by CheckMK. I need to figure out how to make Grafana accept them. Any tips?
Thanks,
Oskar
