Infrastructure
I am managing a distributed monitoring with Checkmk MSP, configured as follows:
A Master server.
A Slave server.
I have also connected this infrastructure with Grafana to create custom dashboards.
Specific Need
I want to create a dashboard in Grafana that allows filtering hosts by their state (State) using a dynamic filter based on a tag configured in Checkmk (for example, tag_category = network).
Attached Images
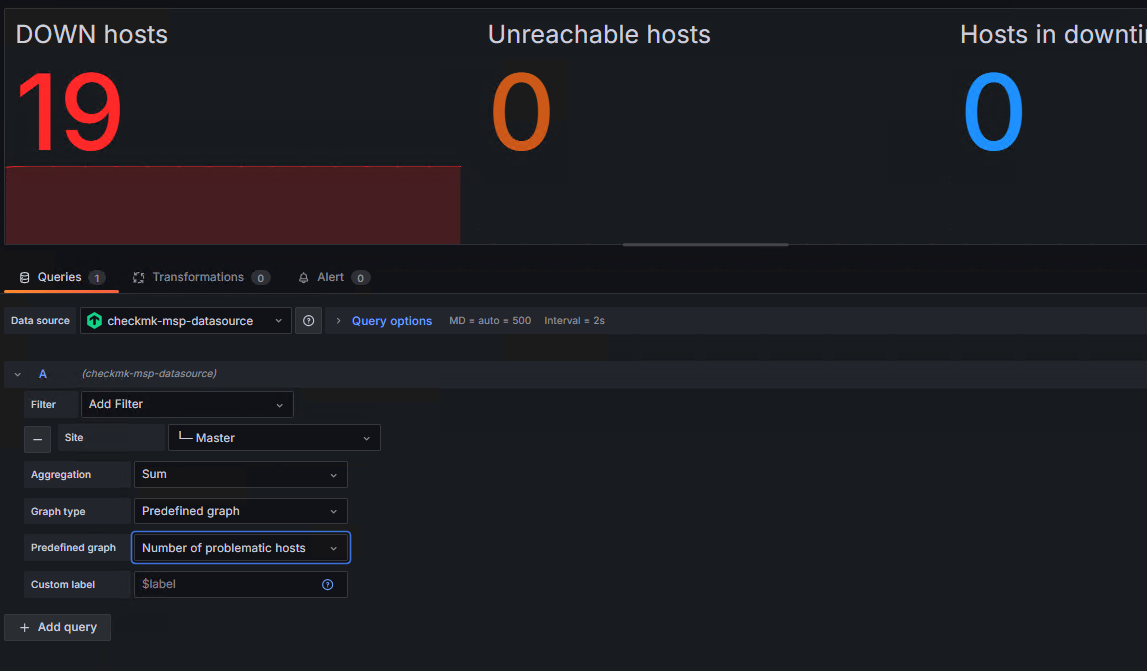
Example 1 (“Img_1”): Currently, I can view the global state of the hosts (UP, DOWN, WARN, UNKNOWN) without problems.
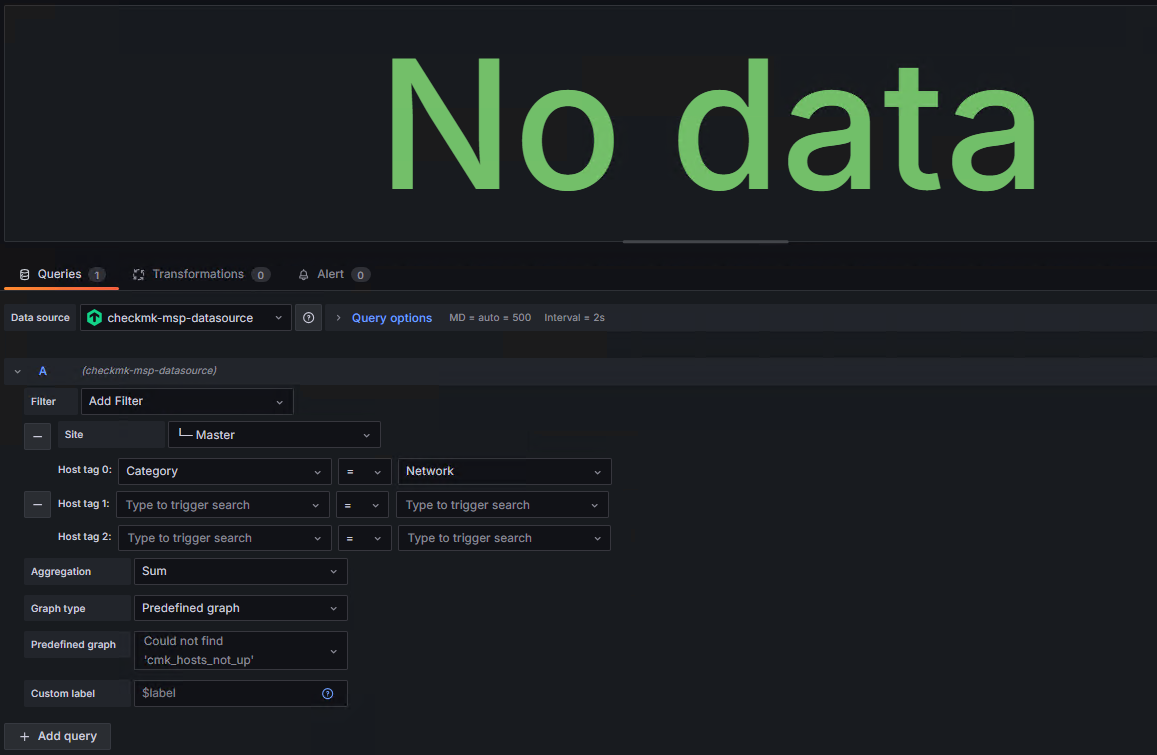
Example 2 (“Img_2”): However, when trying to add a filter by tag category (tag_category), which groups several computers, the error appears:
“The value ‘cmk_host_not_up’ was not found” in the Predefined graph section.
Issue
When I add a filter in the query, such as tag_category = network, Grafana fails to find the corresponding values, even though hosts with that tag do exist in Checkmk.
My goal is to setup a dynamic filter in Grafana that allows to filter all host states (UP, DOWN, WARN, UNKNOWN) based on a specific network device tag.
I would appreciate any guidance or solution to address this issue.