Did the test with problem_percentage_2.1.py on 2.1.0.p11 cee
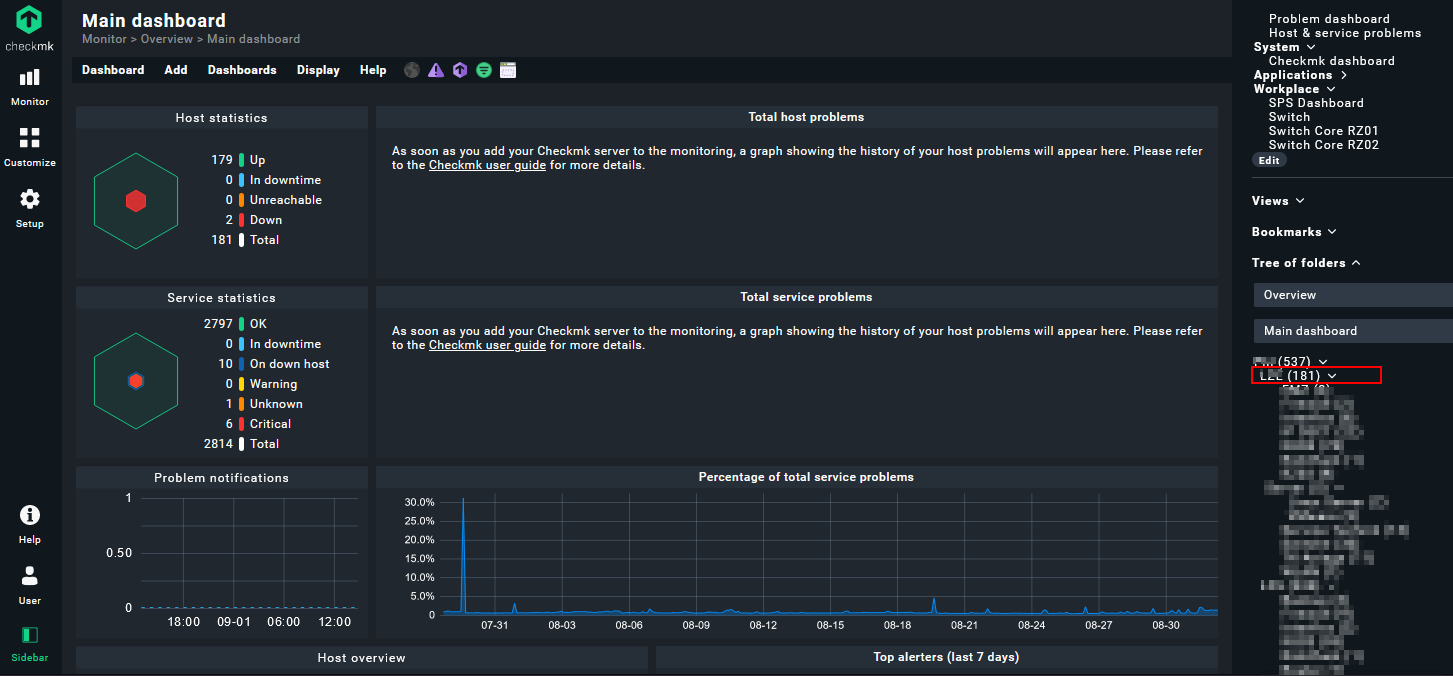
“Percentage of total service problems” is showing data in Subfolder.
[root@linux dashboard]# pwd
/opt/omd/versions/2.1.0p11.cee/lib/python3/cmk/gui/cee/plugins/dashboard
[root@linux dashboard]# diff problem_percentage.py problem_percentage.py.bak
48c48
<         return ("explicit", self._recipe())
---
>         return ("explicit", self._recipe(context))
50,55c50
<     def _recipe(self) -> Dict[str, Any]:
<         context = {
<             "service_cmk_site_statistics_core_pid": {
<                 "service_cmk_site_statistics_core_pid": "",
<             },
<         }
---
>     def _recipe(self, context: VisualContext) -> Dict[str, Any]: