I believe we have a similar Problem.
Main Dashboard “Total Host problems”, “Total service problems” and “Percentage of total service problems” are not working in Subfolder(s):
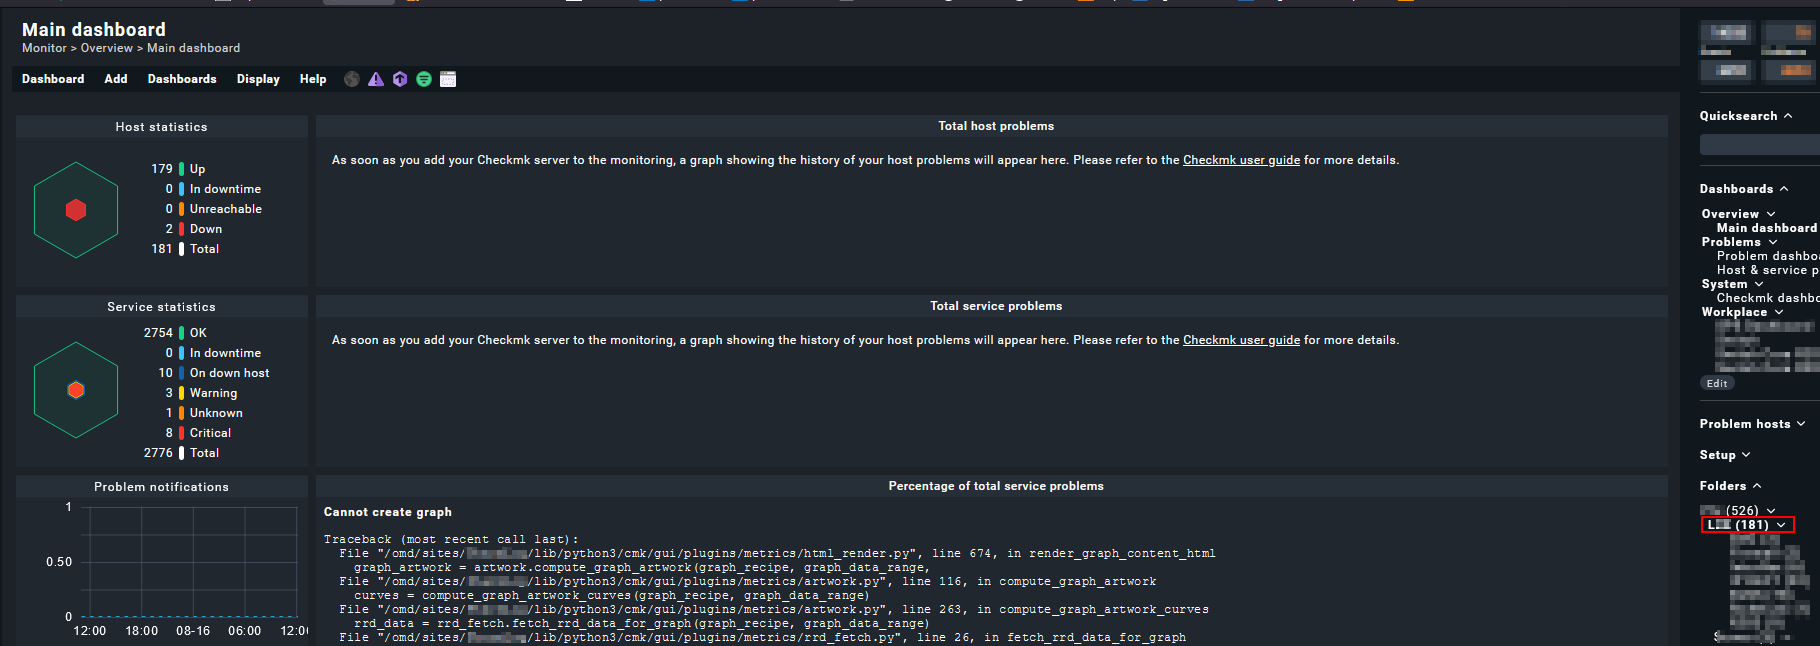
I can open the Graphs / Views if i click on “Total Host problems”, “Total service problems” and “Percentage of total service problems”.
The Top Folder looks to be ok.
“Total Host problems” and “Total service problems” already have Service: “cmk_site_statistics (core PIDs)”. For “Percentage of total service problems” it looks like there is no Service Settings in checkmk 2.0.x
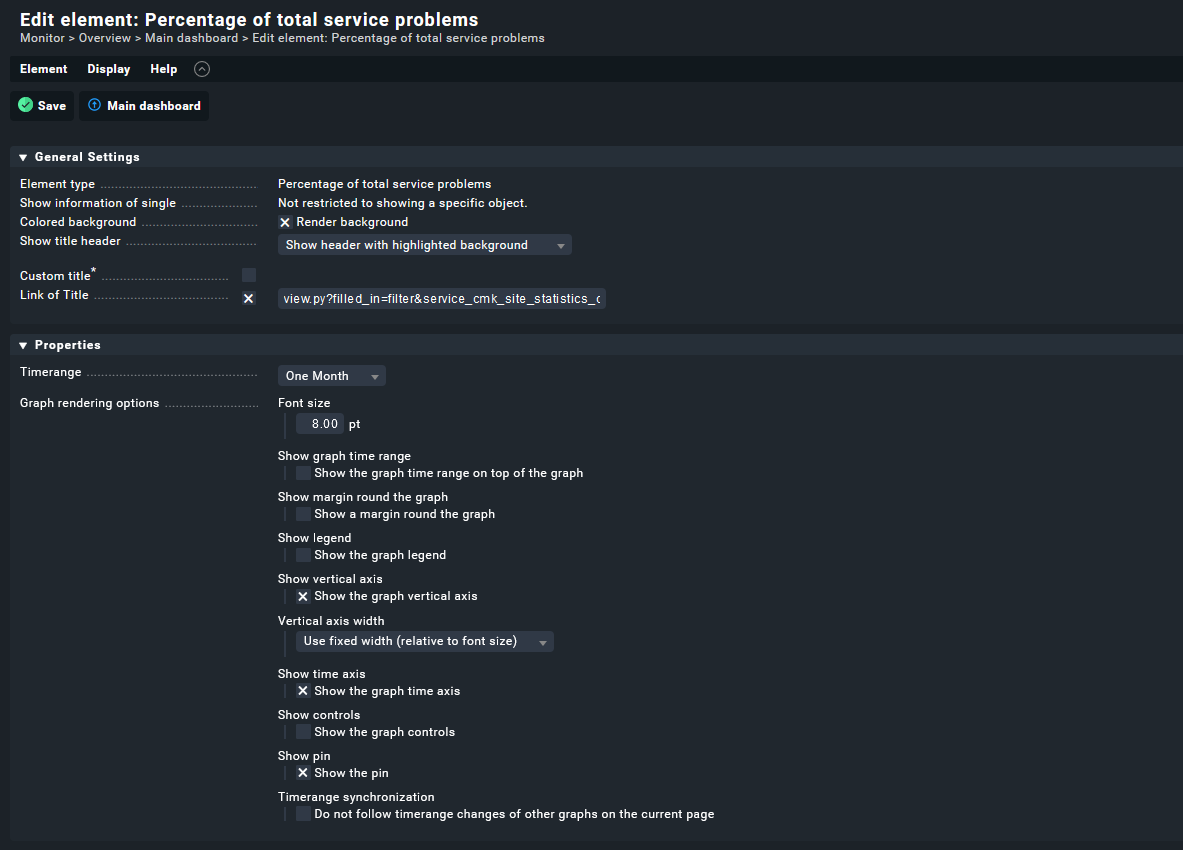
Just in case somebody else has trouble finding the Settings:
Main Dashboard → Dashboard → Enter layout mode → Edit properties of this element
checkmk 2.0.0p27 (CEE), no remote Site.