Hi all, first time posting on Checkmk Forum, we’ve been using Checkmk for a couple of years now.
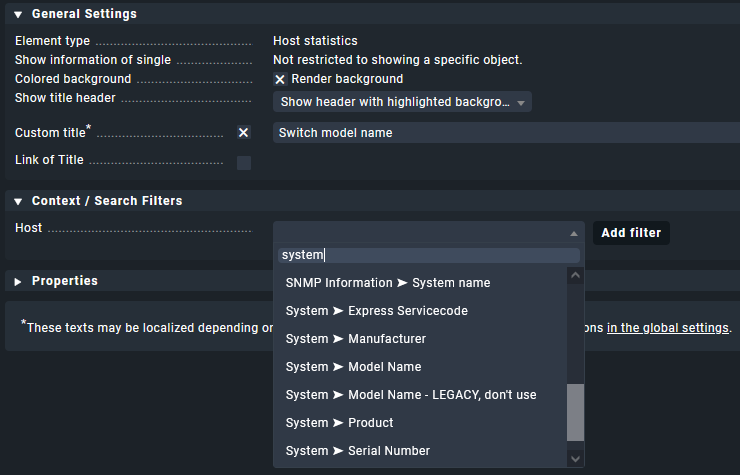
Is it possible to create a graph on a particular model of switch. I can create a view using the inventory, but can’t see anywhere i can create a graph.
We’re rolling out new switches and I want to graph how many of the new switches are deployed.
Unfortunately I can’t use Host data, as we use stacked switches with upto 5 switches stacked, but will only be 1 host. it looks like the only way i can gather this number of switches is via the inventory. Do you know if its possible to create an element similar to your screenshot but using inventory data?
I think I know which information you are looking for. Let’s see what Checkmk has to offer.
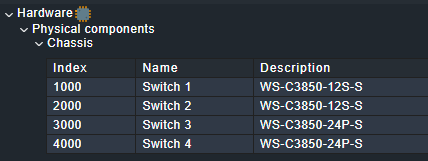
Stacks of switches can be found unter “Hardware->Physical->Components” in HW-/SW-Inventory:
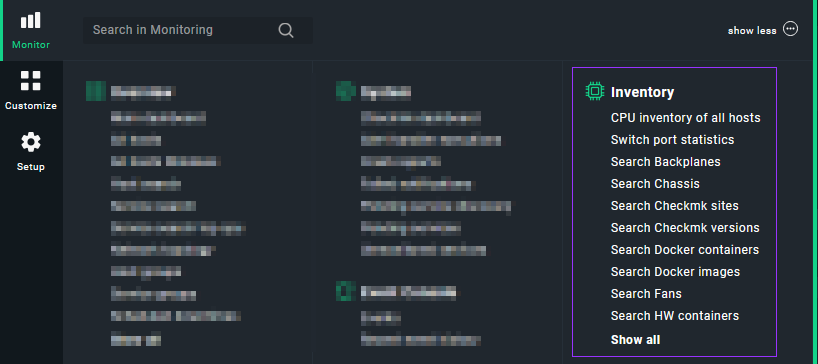
But this information is not directly accessible through the UI (the path is “hardware”->“components”->“chassis” under the hood). When I tried to build a view with this information I could not find the right field to search or filter for. But this table is coming from somewhere inside Checkmk… Edit: Sometimes distance and thinking about a problem again helps a lot. The inventory data can be found with “Search chassis”. But you still have to analyze and graph this data somewhere else.
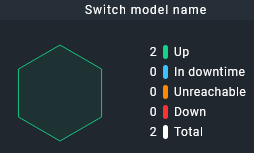
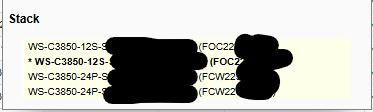
It is possible to query the livestatus for the mk_inventory and read the table. I’m building our own dashboards with (not only from Checkmk) aggregated information. Then I have a representation of the stacked switches like this:
The current master is marked.
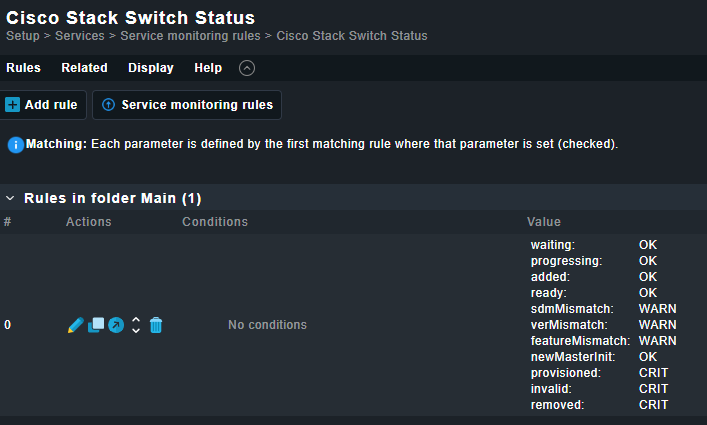
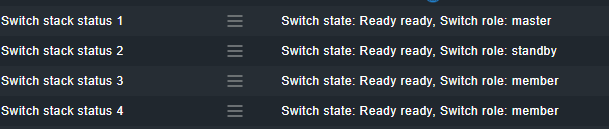
The cisco switches even have more usefull information inside Checkmk:
This information will be located in the check output and thus be usable for us to achieve a count of “configured” and “not yet provisioned” switches vs. the total number of switches (of a stack).
Finally this can be wrapped up in a service with performance data which you can graph inside Checkmk. We plot the graphs externally with plotly.
I have not seen the stack state implemented for non-Cisco switches. In that case your solution is further away. When the information in the HW-/SW-Inventory table is helpful, just ask for my python snippet and I will send it to you (runs inside the instance).