CheckMK Server
cmk -npv --no-cache --detect-plugins=local HOSTNAME
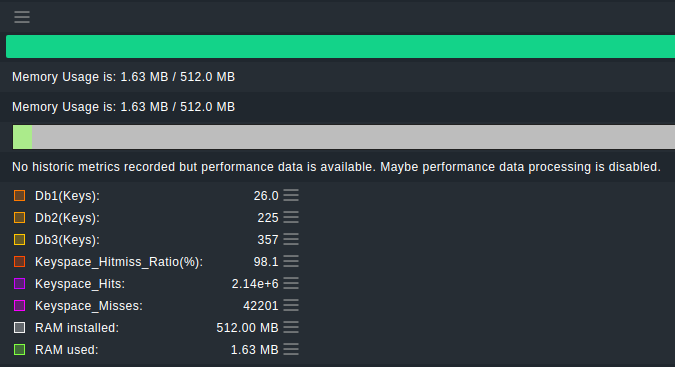
Redis-Memory Memory Usage is: 1.63 MB / 512.0 MB (mem_total=536870912;;;; mem_used=1708352;;;; keyspace_hits=2142524;;;; keyspace_misses=42201;;;; keyspace_hitmiss_ratio(%)=98.07;;;; db1(KEYS)=26;;;; db2(KEYS)=225;;;; db3(KEYS)=357;;;;)
Monitored Host CheckMK Agent Output
check_mk_agent -v | grep -A3 "<<<local"
<<<local:sep(0)>>>
0 "Proxmox Backup Client" fs_used=21090532658|fs_growth=41.9|fs_trend=41.9 OK
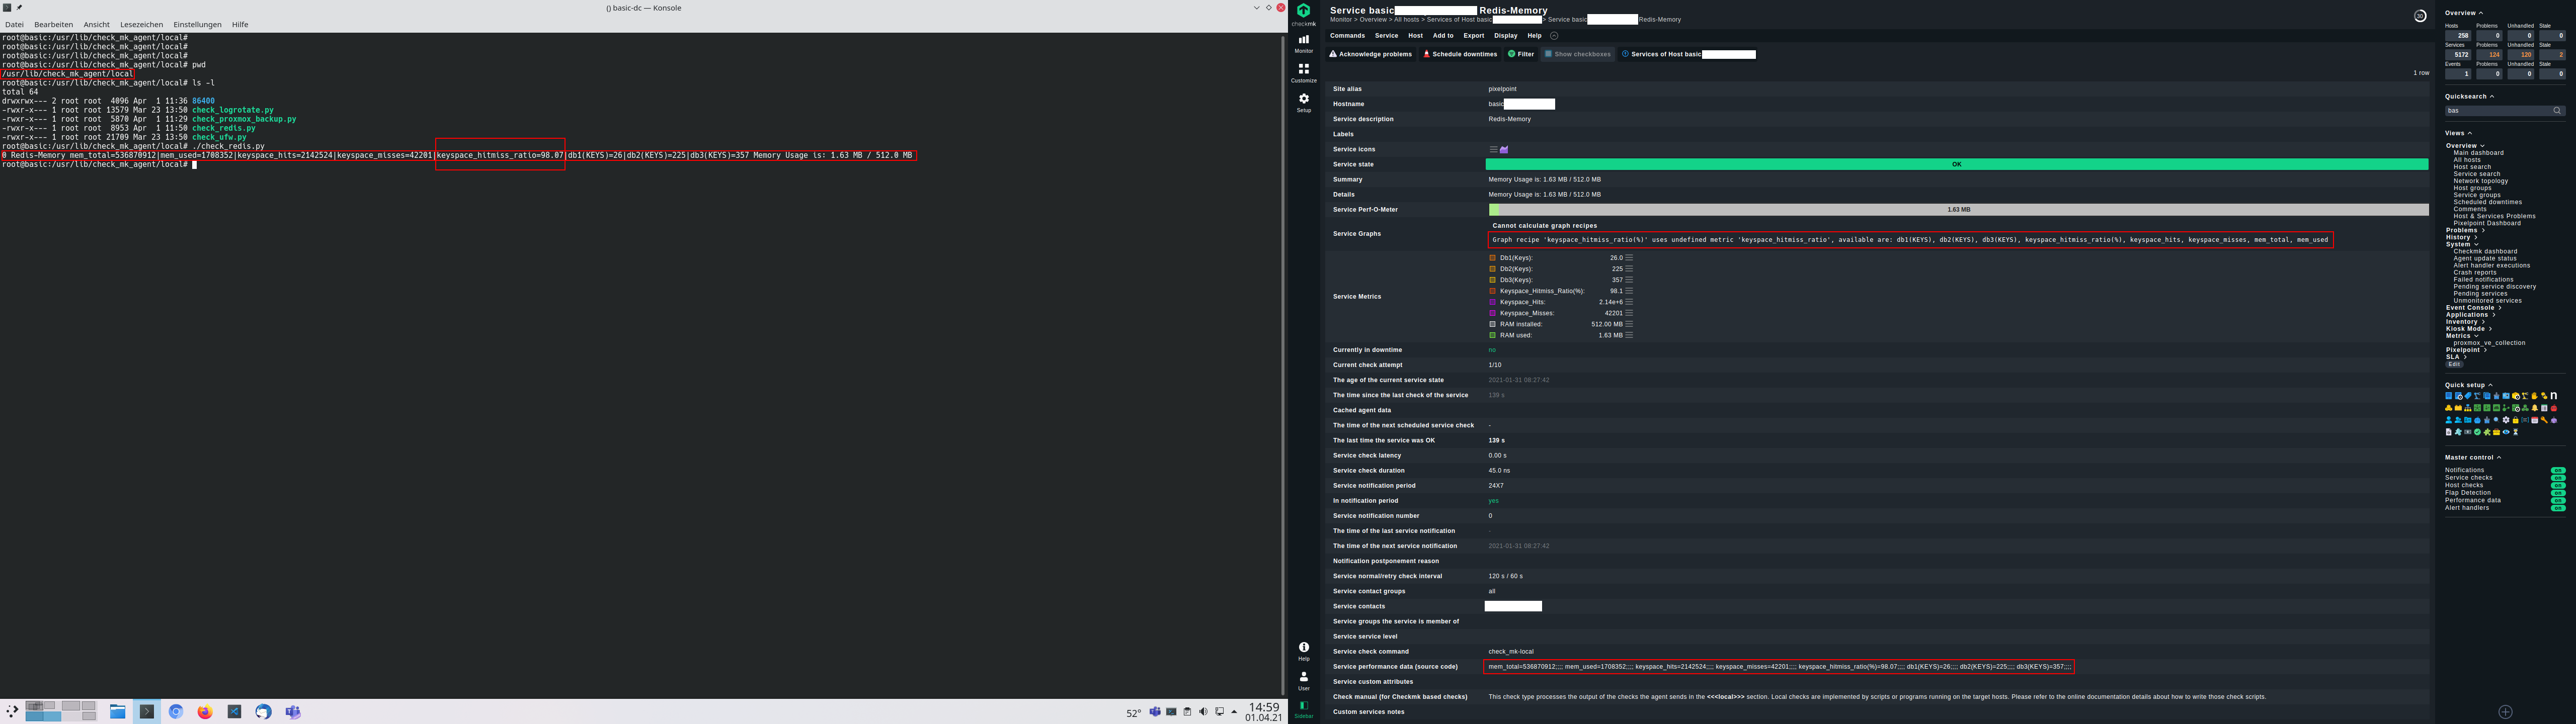
0 Redis-Memory mem_total=536870912|mem_used=1708352|keyspace_hits=2142524|keyspace_misses=42201|keyspace_hitmiss_ratio=98.07|db1(KEYS)=26|db2(KEYS)=225|db3(KEYS)=357 Memory Usage is: 1.63 MB / 512.0 MB
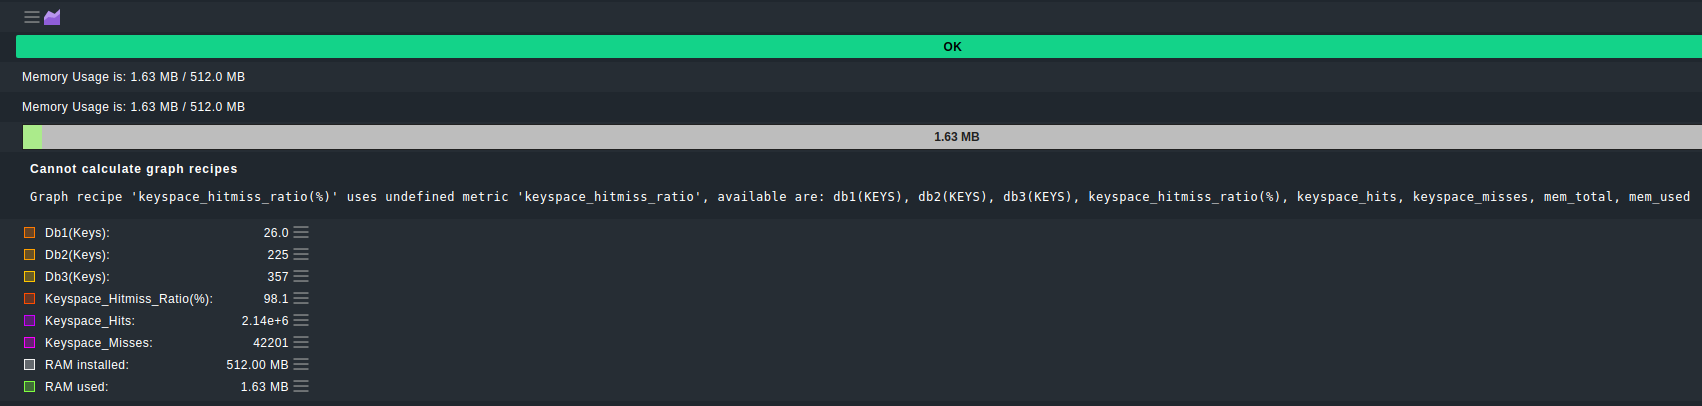
So the CheckMK Agent on the monitored host IS reporting back keyspace_hitmiss_ratio but the CheckMK Server lists this as keyspace_hitmiss_ratio(%)
I do not have any rewrite / translate rules for metrics in place.
All my local check does is gather Information from redis and output metrics while giving them names which should clarify what they are meant to be.
The keyspace metric does not come from an extension, it’s just the name my local check assigns to the information gathered.
GREP keyspace (on CheckMK Server in homedir of site user)
I seperated stuff that belongs together in the output with a newline.
Info:
I write Checks, push them to git and symlink them to the appropriate directory, so the CheckMK Agent Bakery always got the up to date version of a local check if I issue git fetch && git pull before baking the agent.
grep -R keyspace ./*

Binary file ./bin/redis-cli matches
Binary file ./bin/redis-server matches
Binary file ./bin/redis-benchmark matches
Binary file ./bin/redis-sentinel matches
Binary file ./bin/redis-check-aof matches
Binary file ./bin/redis-check-rdb matches

./git/checkmk-local-checks/check_redis.py:        self.keyspace_hits = 0
./git/checkmk-local-checks/check_redis.py:        self.keyspace_misses = 0
./git/checkmk-local-checks/check_redis.py:            elif 'keyspace_hits:' in line:
./git/checkmk-local-checks/check_redis.py:                self.keyspace_hits = int(line.split(':')[1])
./git/checkmk-local-checks/check_redis.py:            elif 'keyspace_misses:' in line:
./git/checkmk-local-checks/check_redis.py:                self.keyspace_misses = int(line.split(':')[1])
./git/checkmk-local-checks/check_redis.py:    def get_keyspace_hits(self):
./git/checkmk-local-checks/check_redis.py:        """ returns keyspace_hits info from redis-cli """
./git/checkmk-local-checks/check_redis.py:        return self.keyspace_hits
./git/checkmk-local-checks/check_redis.py:    def get_keyspace_misses(self):
./git/checkmk-local-checks/check_redis.py:        """ returns keyspace_misses info from redis-cli """
./git/checkmk-local-checks/check_redis.py:        return self.keyspace_misses
./git/checkmk-local-checks/check_redis.py:    # add metrics for keyspace (hits, misses, percentage)
./git/checkmk-local-checks/check_redis.py:    service_output += cmk_service['metric_sep']+""+cmk_service['metric_keyspace_hits_prefix']+""+str(cmk_service['keyspace_hits'])
./git/checkmk-local-checks/check_redis.py:    service_output += cmk_service['metric_sep']+""+cmk_service['metric_keyspace_misses_prefix']+""+str(cmk_service['keyspace_misses'])
./git/checkmk-local-checks/check_redis.py:    hitmissratio = str(round(cmk_service['keyspace_hits']/(cmk_service['keyspace_hits']+cmk_service['keyspace_misses'])*100,2))
./git/checkmk-local-checks/check_redis.py:    # add metrics for keyspace per db (entries)
./git/checkmk-local-checks/check_redis.py:    'metric_keyspace_hits_prefix': 'keyspace_hits=',
./git/checkmk-local-checks/check_redis.py:    'keyspace_hits': 0,
./git/checkmk-local-checks/check_redis.py:    'metric_keyspace_misses_prefix': 'keyspace_misses=',
./git/checkmk-local-checks/check_redis.py:    'keyspace_misses': 0,
./git/checkmk-local-checks/check_redis.py:    'metric_hitmiss_ratio_prefix': 'keyspace_hitmiss_ratio(%)=',
./git/checkmk-local-checks/check_redis.py:    cmk_service.update({'keyspace_hits': redis.get_keyspace_hits()})
./git/checkmk-local-checks/check_redis.py:    cmk_service.update({'keyspace_misses': redis.get_keyspace_misses()})

./lib/python3/botocore/data/elasticache/2015-02-02/service-2.json:      "documentation":"<p>Modifies a replication group's shards (node groups) by allowing you to add shards, remove shards, or rebalance the keyspaces among exisiting shards.</p>"
./lib/python3/botocore/data/elasticache/2015-02-02/service-2.json:          "documentation":"<p>The keyspace for this node group (shard).</p>"
./lib/python3/botocore/data/elasticache/2015-02-02/service-2.json:          "documentation":"<p>A string that specifies the keyspace for a particular node group. Keyspaces range from 0 to 16,383. The string is in the format <code>startkey-endkey</code>.</p> <p>Example: <code>\"0-3999\"</code> </p>"

grep: ./local/share/nagios/htdocs/theme/stylesheets: No such file or directory
grep: ./local/share/nagios/htdocs/theme/images: No such file or directory

./local/share/check_mk/agents/custom/check_redis/lib/local/check_redis.py:        self.keyspace_hits = 0
./local/share/check_mk/agents/custom/check_redis/lib/local/check_redis.py:        self.keyspace_misses = 0
./local/share/check_mk/agents/custom/check_redis/lib/local/check_redis.py:            elif 'keyspace_hits:' in line:
./local/share/check_mk/agents/custom/check_redis/lib/local/check_redis.py:                self.keyspace_hits = int(line.split(':')[1])
./local/share/check_mk/agents/custom/check_redis/lib/local/check_redis.py:            elif 'keyspace_misses:' in line:
./local/share/check_mk/agents/custom/check_redis/lib/local/check_redis.py:                self.keyspace_misses = int(line.split(':')[1])
./local/share/check_mk/agents/custom/check_redis/lib/local/check_redis.py:    def get_keyspace_hits(self):
./local/share/check_mk/agents/custom/check_redis/lib/local/check_redis.py:        """ returns keyspace_hits info from redis-cli """
./local/share/check_mk/agents/custom/check_redis/lib/local/check_redis.py:        return self.keyspace_hits
./local/share/check_mk/agents/custom/check_redis/lib/local/check_redis.py:    def get_keyspace_misses(self):
./local/share/check_mk/agents/custom/check_redis/lib/local/check_redis.py:        """ returns keyspace_misses info from redis-cli """
./local/share/check_mk/agents/custom/check_redis/lib/local/check_redis.py:        return self.keyspace_misses
./local/share/check_mk/agents/custom/check_redis/lib/local/check_redis.py:    # add metrics for keyspace (hits, misses, percentage)
./local/share/check_mk/agents/custom/check_redis/lib/local/check_redis.py:    service_output += cmk_service['metric_sep']+""+cmk_service['metric_keyspace_hits_prefix']+""+str(cmk_service['keyspace_hits'])
./local/share/check_mk/agents/custom/check_redis/lib/local/check_redis.py:    service_output += cmk_service['metric_sep']+""+cmk_service['metric_keyspace_misses_prefix']+""+str(cmk_service['keyspace_misses'])
./local/share/check_mk/agents/custom/check_redis/lib/local/check_redis.py:    hitmissratio = str(round(cmk_service['keyspace_hits']/(cmk_service['keyspace_hits']+cmk_service['keyspace_misses'])*100,2))
./local/share/check_mk/agents/custom/check_redis/lib/local/check_redis.py:    # add metrics for keyspace per db (entries)
./local/share/check_mk/agents/custom/check_redis/lib/local/check_redis.py:    'metric_keyspace_hits_prefix': 'keyspace_hits=',
./local/share/check_mk/agents/custom/check_redis/lib/local/check_redis.py:    'keyspace_hits': 0,
./local/share/check_mk/agents/custom/check_redis/lib/local/check_redis.py:    'metric_keyspace_misses_prefix': 'keyspace_misses=',
./local/share/check_mk/agents/custom/check_redis/lib/local/check_redis.py:    'keyspace_misses': 0,
./local/share/check_mk/agents/custom/check_redis/lib/local/check_redis.py:    'metric_hitmiss_ratio_prefix': 'keyspace_hitmiss_ratio(%)=',
./local/share/check_mk/agents/custom/check_redis/lib/local/check_redis.py:    cmk_service.update({'keyspace_hits': redis.get_keyspace_hits()})
./local/share/check_mk/agents/custom/check_redis/lib/local/check_redis.py:    cmk_service.update({'keyspace_misses': redis.get_keyspace_misses()})

./share/snmpsim/variation/redis.py:    if ('current-keyspace' not in recordContext or
./share/snmpsim/variation/redis.py:            recordContext['current-keyspace'] != keySpace):
./share/snmpsim/variation/redis.py:        log.msg('redis: now using keyspace %s (cycling period %s)' % (keySpace, recordContext['settings']['period'] or '<disabled>'))
./share/snmpsim/variation/redis.py:        recordContext['current-keyspace'] = keySpace

grep: ./tmp/run/redis: No such device or address
grep: ./tmp/run/dcd.sock: No such device or address
Thanks for your time,
Pixelpoint