CheckMK version: 2.3.0p23 enterprise OS version: Ubuntu 24.04 LTS
I have noticed a change in behaviour of the autoscaling feature of graphs in version 2.3. I have searched through all the Werks, but can’t find any mention of this change.
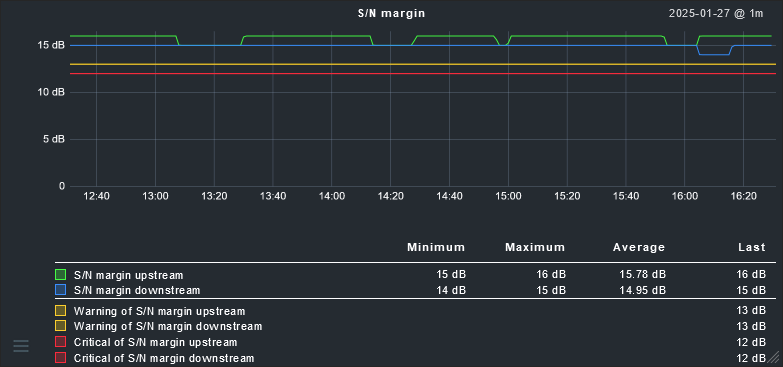
This is an example of a graph that is rendered in CheckMK v2.3 enterprise:
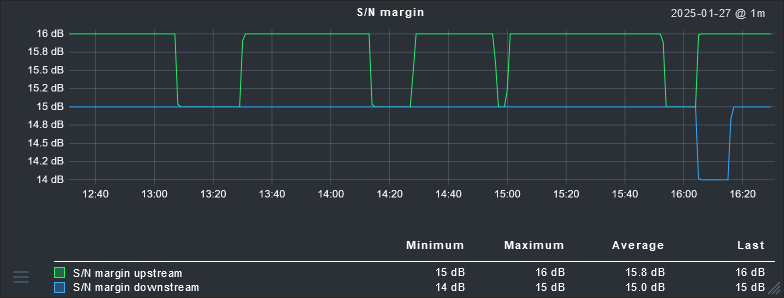
The difference is obvious. In v2.2 (and earlier) the vertical scale is adapted to both the upper and the lower limit of the displayed data. In v2.3 though, only the upper limit is used for calculating the vertical scale, the lower limit is “0” at max (or negative when negative numbers are displayed).
Due to this change, small variants around a setpoint are harder to spot. Which is regrettable, because most of the time, the devil is in the details.
Dear fellow forum users, do you recognize this change in behaviour? And if so, has anyone found a way to recreate the “old” behaviour in v2.3? Any suggestions will be highly appreciated!
I can hardly imagine that I am the only one that ran into this change of behaviour of the graphs, or am I mistaking?
How can I configure the pre-2.3 behaviour of the vertical scale?
Reaching out to the CheckMK developers: do you recognize this change? If so, are there any plans to make the behaviour of the vertical scale configurable (zero based or minimum based)?
I have found out that the vertical axis scaling mode can be manipulated using “Graph tunings”, accessible through Customize->Graph tunings. Under “Vertical axis scaling mode”, one of 3 possible modes can be selected:
Use default scaling mode (default)
Compute range accor(d)ing to displayed data (with typo)
Explicit range
I can not find what the “default scaling mode” is, nor how to set this, but obviously “Compute range according to displayed data” is what I am looking for. Unfortunately, when I apply the graph tuning with this setting to underneath graph, is has no effect.
Because choosing “Explicit range” does have the intended result, I am certain that the graph tuning is applied to the correct graph.
This leads me to the conclusion that the computation of the vertical scale for graphs is broken starting from version CEE v2.3, so we are dealing with a bug here.
Bumping this thread, because this issue is still present in the latest patch releases (2.3.0p35/2.4.0p8). @Sara: any plans to address this issue in the coming Werks?
Based on your first message, I assume that you created these graphs using the “Custom graph” mode. Am I correct ?
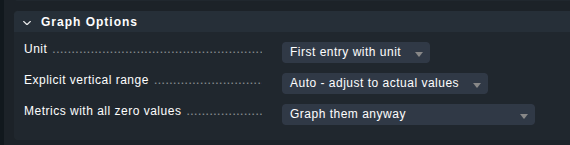
If so, could you please verify whether the “Explicit vertical range” setting is set to “Auto - adjust to actual values” ?
No this problems happens on all graphs. The autoscaling Y axis is broken at the 2.3 & 2.4.
The only option that is working, is to define an explicit range. This will not help in environments with more than 1 or 2 sensors