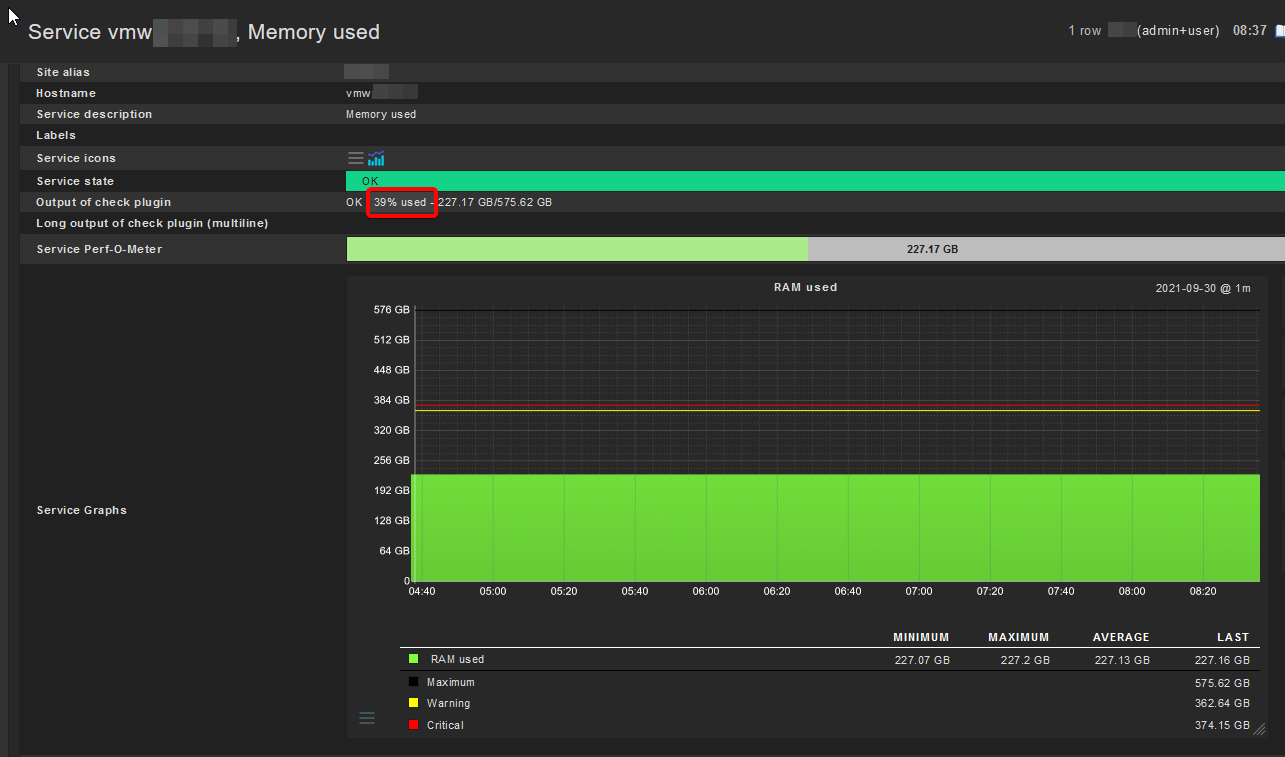
How can I create a graph of the PERCENTAGE of memory used for my vSphere cluster? The percentage is shown in the long output, but the only graph provided is absolute RAM used.
the percentage value is calculated inside the check to get a more human readable value to display for check output. If you scroll down in your view you get the raw performance data gathered from the vSphere agent.
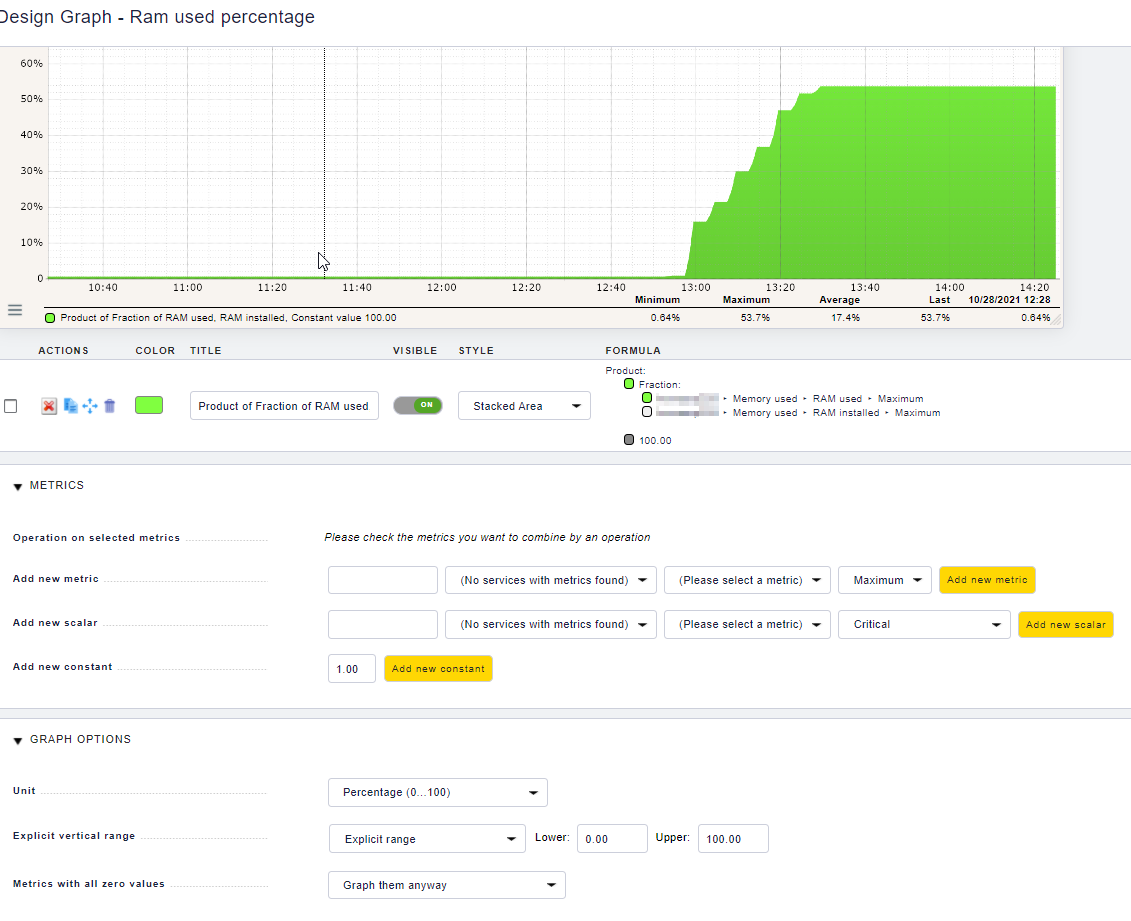
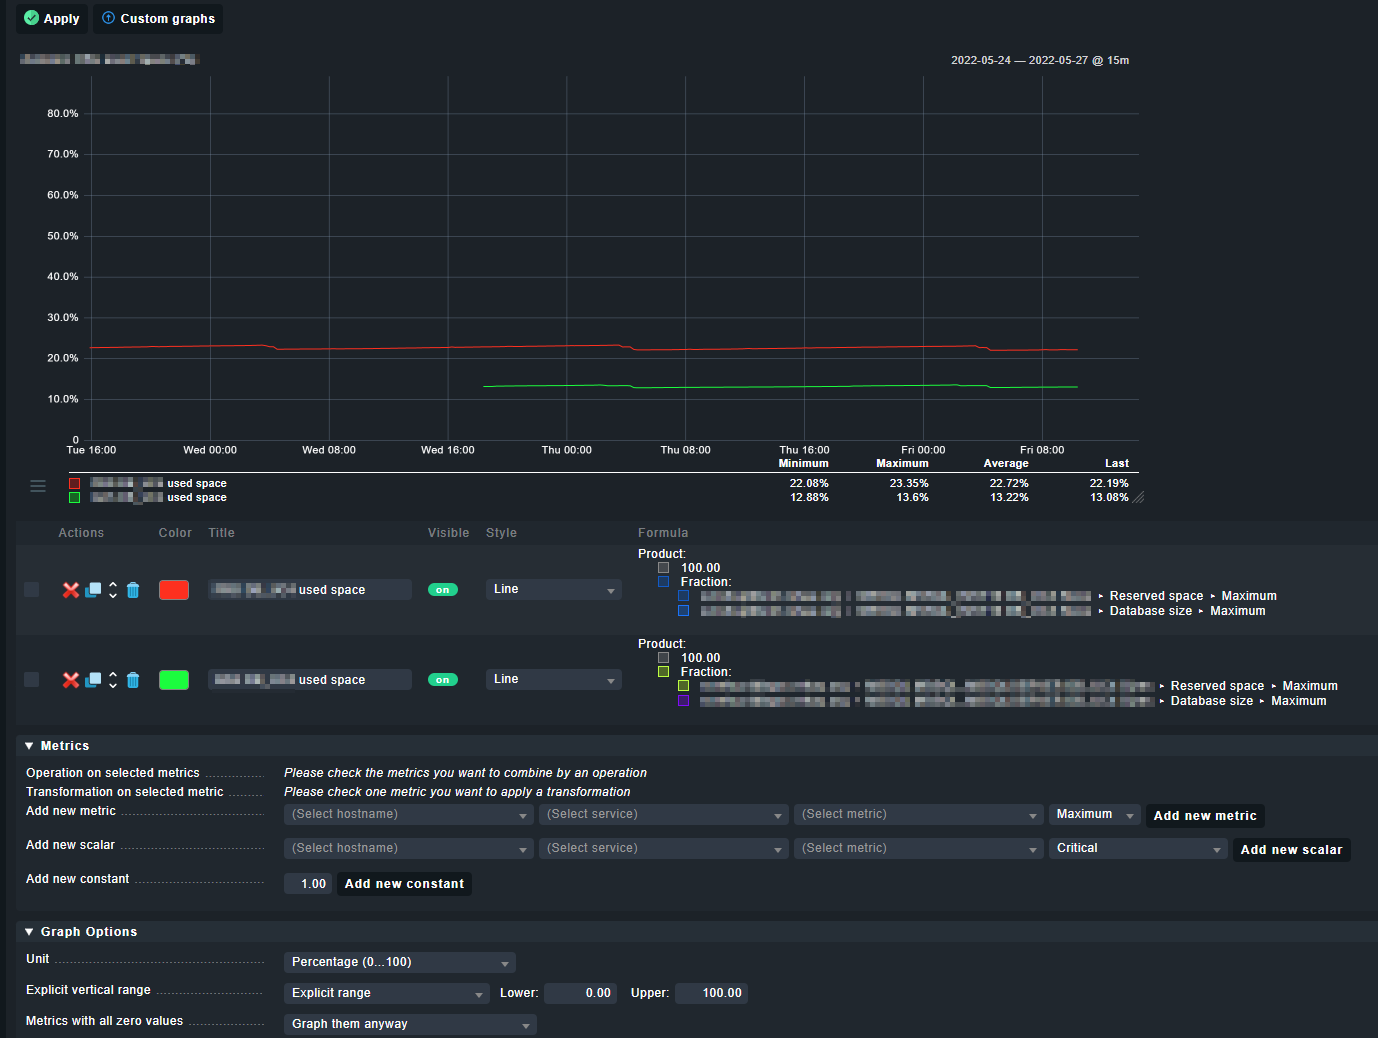
You can use this performance data to design your own graphs (custom graphs) to use on dashboards and so on:
Thanks… I never noticed the “fraction” option before. Unfortunately, I got a bunch of python errors on the one I tried… but I will continue to experiment with this as I’m pretty certain it’ll give me what I want if I get past the errors.
Hi, Thanks for this, it nearly worked, but when I use the fraction function, I am getting values under 1 (like 0,13). Even if I use percentage as value, the graph is under 1. So I have to add the constant 100 to multiply the new graph with. What am I doing wrong?
This topic was automatically closed 365 days after the last reply. New replies are no longer allowed. Contact an admin if you think this should be re-opened.