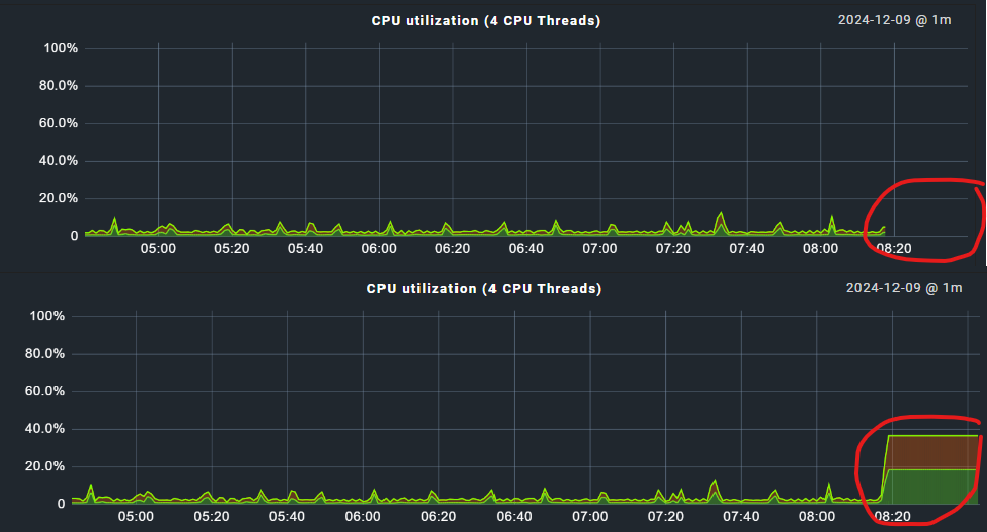
When a service is stale and does not receive any data, the graph of that service displays a gap for the corresponding time period. This is actually the behaviour that I would expect. However, when that service receives data again, the gap is gone and the graph displays data instead of the gap.
I noticed this while developing a custom agent plugin to monitor Active Directory Health, but this behavior seems to be a general one. The screenshots below are from a virtual machine that was switched off for a couple of minutes.
We are using this version: Checkmk Enterprise Edition 2.3.0p21
Is it possible at all to make the graphs show gaps for times where no data was received? Shouldn’t this be the default behavior? When troubleshooting an issue I surely want to know whether data was received during a specific time period!
No - as here the used storage (RRDTool) defines the behavior. https://oss.oetiker.ch/rrdtool/doc/rrdcreate.en.html
The magic option is “heartbeat” for the RRD file.
Sadly you cannot set this option inside the rule for the RRD creation.
Yes this is working as intended.
Changes can be made but not in an easy and supported way inside the GUI.
For enterprise users it is way harder to change anything here.
If you use the RAW edition with classic PNP4Nagios backend there are config files to change this behavior.
OK, good to know. We’ll have to live with it then. Thank you very much for you help!
I’m just a little curious: Hasn’t this bothered anybody yet? I mean, if there is an actual lack of monitoring data, that should be reflected in the monitoring graphs, or am I just being reeeeeaaaally picky?
It’s been bothering me as well, yes, just not enough to actually look into it in detail. Now I’m tempted to find the mentioned config files and change it…
We used to use Nagios (later Icinga classic) for monitoring and Cacti for graphing (which also uses RRD) before migrating to CMK, and I’m pretty sure the Cacti graphs had gaps. I find it useful to indicate that there is no data for that time range, which otherwise might not be as obvious and suggest that everything was fine even if it wasn’t. Or, if the graph is fluctuating before and after an outage, you might even wonder why there is a straight line instead of peaks.
Thanks, heartbeat was the term that helped me figure it out.
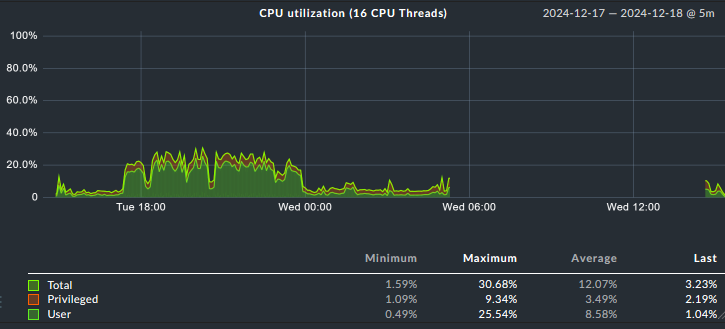
I’m assuming that there are gaps if the “outage” is longer than what’s set as HEARTBEAT interval in the pnp4nagios config (in CRE anyway). I produced a longer outage here, and there is a gap:
@Jay2k1 Thanks very much for helping clearing that up. Looks like we still have to live with it since we are using the enterprise edition but it’s good to have an explanation for this behavior.
Inside enterprise edition this value is hardcoded → ~/lib/check_mk/base/cee/rrd.py
→ rrd_heartbeat = 8460
You can change this value but it is then active for all newly created RRDs.
Normally it is not a big thing to add this value to the config parameters you already have for RRD files inside CMK.
This topic was automatically closed 365 days after the last reply. New replies are no longer allowed. Contact an admin if you think this should be re-opened.