I have around 200 services for one host, 160 of these are pool and queue for CI/CD tool for different pools.
For example, I have sth like below:
project1.pool1
project1-XXX.pool2
project1-YYY.pool3
project1.queue1
project1-XXX.queue2
project1-YYY.queue3
project2.pool1
project2.queue1
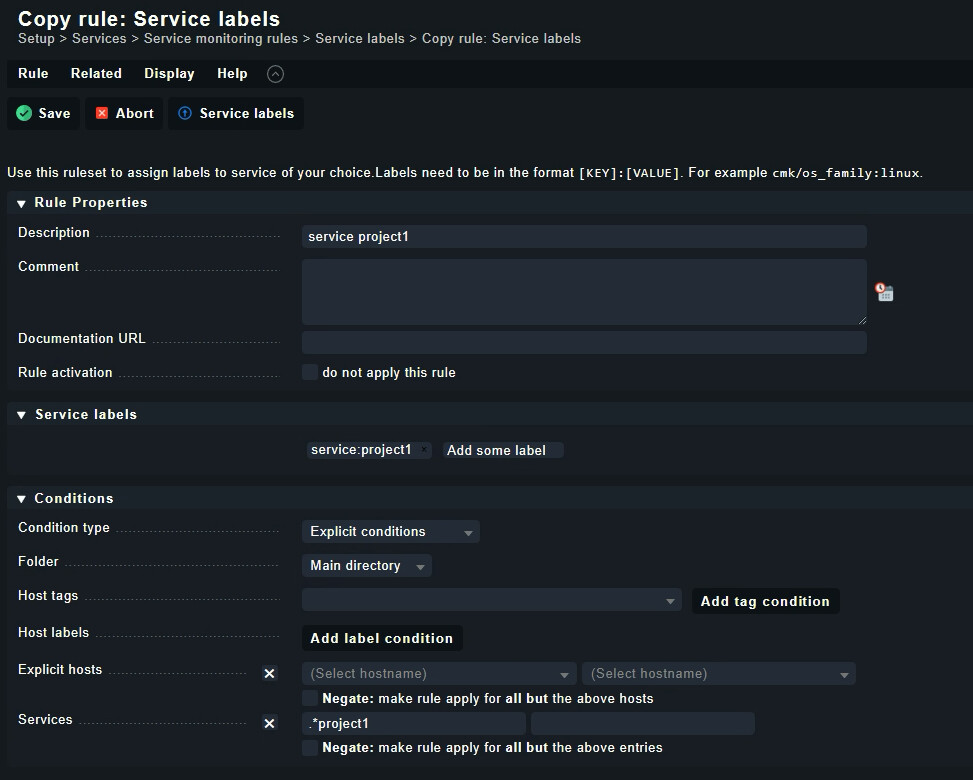
I have created a label rule which adds the label to services automatically.
For project1 it adds label service:project1 and for project2 it adds service:project2.
Now I want to show the values from the services on the graph. At first I created a Custom graph and added all the services, without any labels. The graph was rendered but it is unreadable and the legend does not show all positions.
Another idea is to create the graph dynamically, based on the label value entered in the filter.
Is it possible to do this? I have tested all graph types and have not found a solution for this.
**CMK version: 2.0.0p29