I’m fiddling with my first agent-based plugin. It’s for a switchable metering PDU.
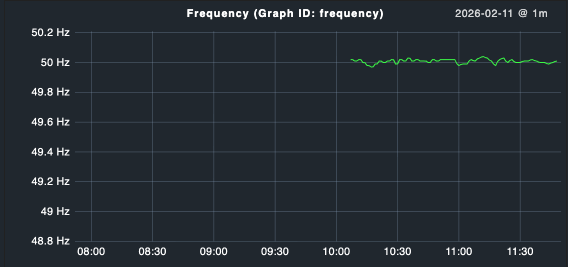
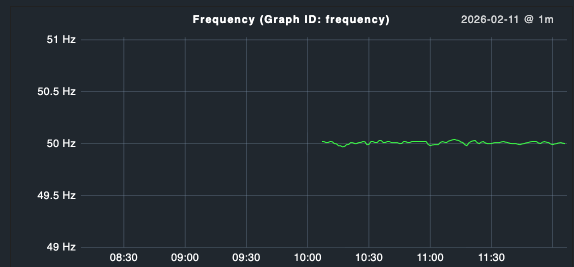
I’m trying to properly graph the power grid frequency. As we all know, it should be 50Hz (in Europe), but has very small fluctuations. Hence, I set MinimalRange(49.8, 50.2) on the graph (giving a minimal Y axis range of 0.4 Hz).
However, it looks like it graphs from 48.8 Hz to 50.2 Hz:
What you’re seeing is expected behavior from the underlying RRDtool graph rendering — not a bug in your plugin.
Why it happens: MinimalRange defines the minimum span of the Y axis, but Checkmk/RRDtool automatically adds a padding margin (roughly 20% of the range) below the lower boundary so data points don’t sit right at the edge of the graph. The larger your range, the more padding gets added — which matches exactly what you observed:
Range 0.4 → ~1 Hz padding below
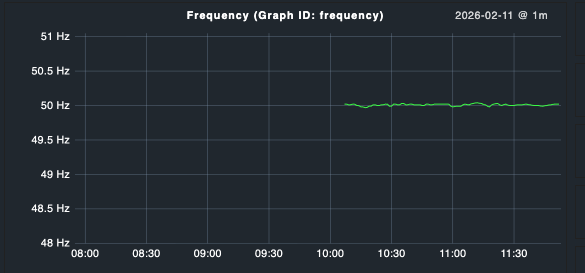
Range 2 → ~1 Hz padding below
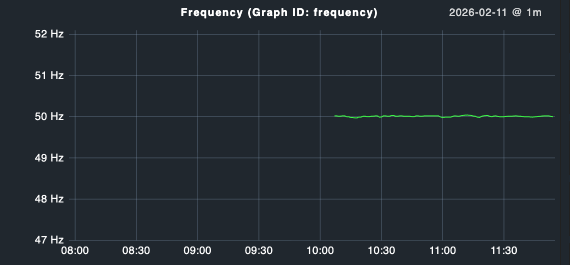
Range 4 → ~1 Hz padding below
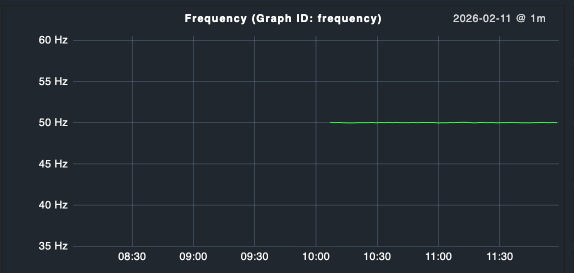
Range 20 → ~5 Hz padding below
Workarounds:
Compensate manually — set the lower value higher than your actual minimum to counteract the padding. For a 49.8–50.2 target, try MinimalRange(50.0, 50.2) or similar and experiment.
Use FixedBounds instead (if available in your CMK version) — this sets hard Y axis limits without padding:
FixedBounds(lower=49.8, upper=50.2)
Check the Checkmk graphing API docs for your version to see if this is available.
Use quantity metric type with explicit bounds — depending on how your metric is defined, specifying explicit min/max values in the metric definition can influence the graph range more directly.
For your use case (tight frequency monitoring around 50 Hz), FixedBounds would be the cleanest solution if supported. Otherwise option 1 with some trial and error gets you close enough.
It looks a lot like it was AI generated, and unfortunately, it also “behaves” like an AI answer in that it looks well-formatted and very promising, but upon closer inspection, it turns out mostly useless:
the info about the padding (if accurate) makes sense and explains why I experience the issue
workaround 1 is what I’ve already tried with several different combinations, but couldn’t get to deliver a satisfying result, hence my forum post
workaround 2 does not exist - funnily enough, it says “if available in your CMK version”, followed by a link to the docs, in which FixedBounds does not appear a single time
workaround 3, a “quantity metric type”, also doesn’t seem to exist according to the docs. However, it mentioned adding “explicit min /max values in the metric definition”, which I tried using boundaries:
…but that also didn’t solve the problem (the graph range started at 0 with that).
I guess there is no real solution that would lead to my desired outcome.
Maybe I’m wrong about the AI assumption, in which case I apologize, but if not, I’d recommend clarifying that the response is AI generated and hence to be taken with a grain of salt, e.g. “I don’t actually know how to solve your issue, but I’ve asked an LLM and this is what it came up with, maybe that helps: …”
This would help setting the right expectations. Unfortunately, AI often tends to hallucinate things…
MinimalRange(lower, upper) – and according to the documentation: “The vertical axis will be extended if the metrics exceed the minimal range, but it will never be smaller.”
This means that MinimalRange is actually only a minimum, not a hard limit. RRDtool adds additional padding – that is the real problem.
And in v1.metrics, there are MinimumOf and MaximumOf – but they extract min/max values from the metric data itself, not as fixed axis limits.