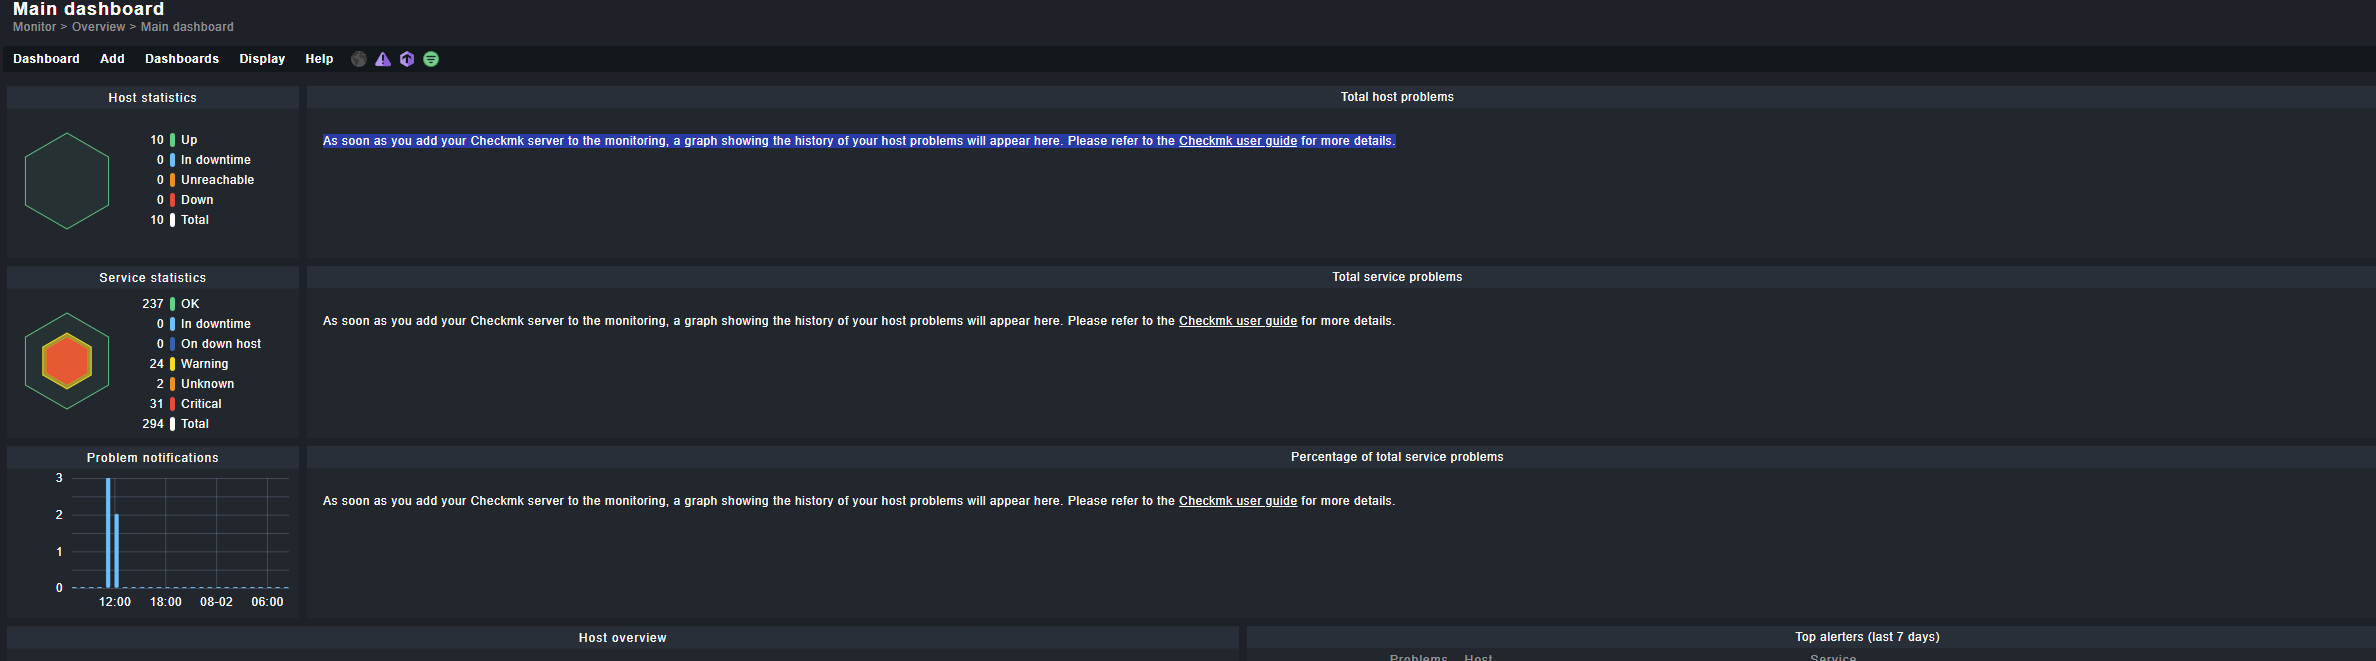
Error message: As soon as you add your Checkmk server to the monitoring, a graph showing the history of your host problems will appear here. Please refer to the Checkmk user guide for more details.
I’m encountering an issue where my graphs are not showing up in CheckMK. The dashboard shows that the services and hosts are being monitored, but the graphs for the metrics are missing. I’m hoping someone can help me troubleshoot this.
Issue Description:
The main dashboard and detailed views are not displaying graphs for the monitored services and hosts. The graphs used to work, but they have recently disappeared.
What I’ve Tried So Far:
Verified Time Range:
Ensured that the selected time range in the dashboard includes the period where data should be available.
Checked Data Collection:
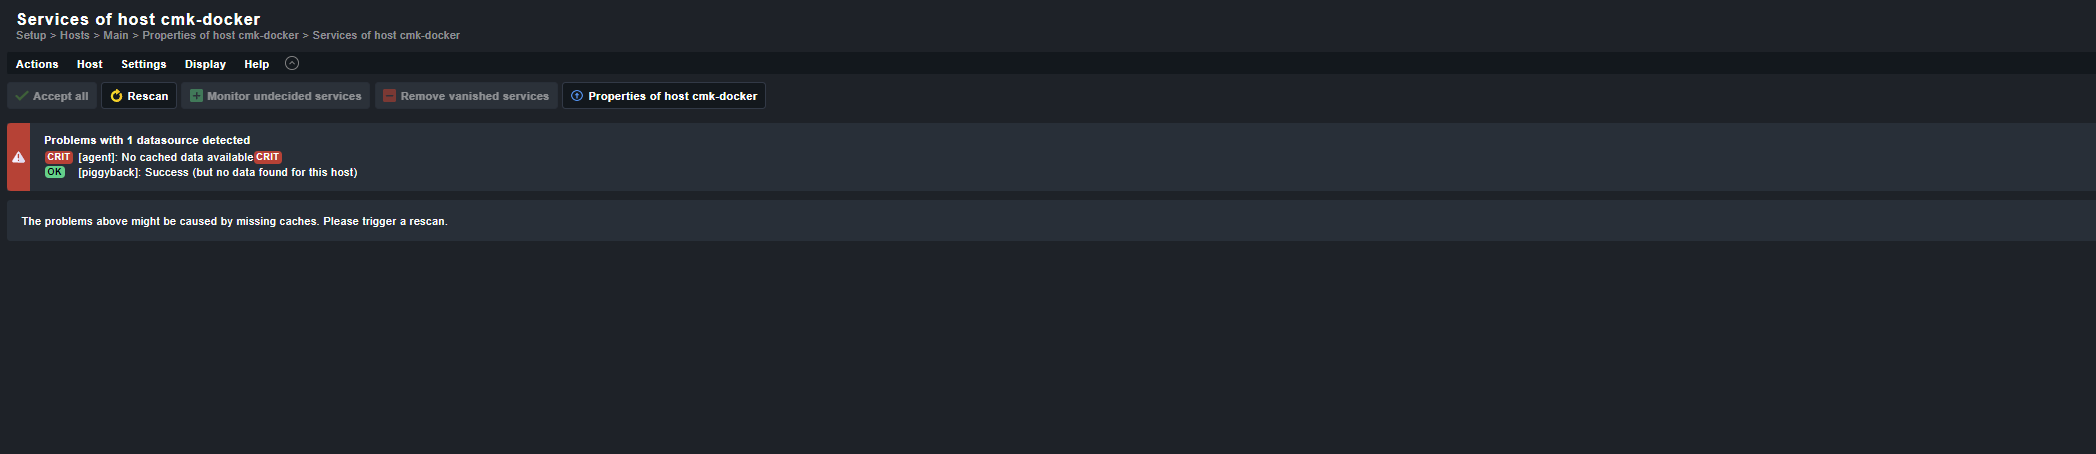
Verified that data collection is active and services are being monitored. The service statistics and host statistics are showing up.
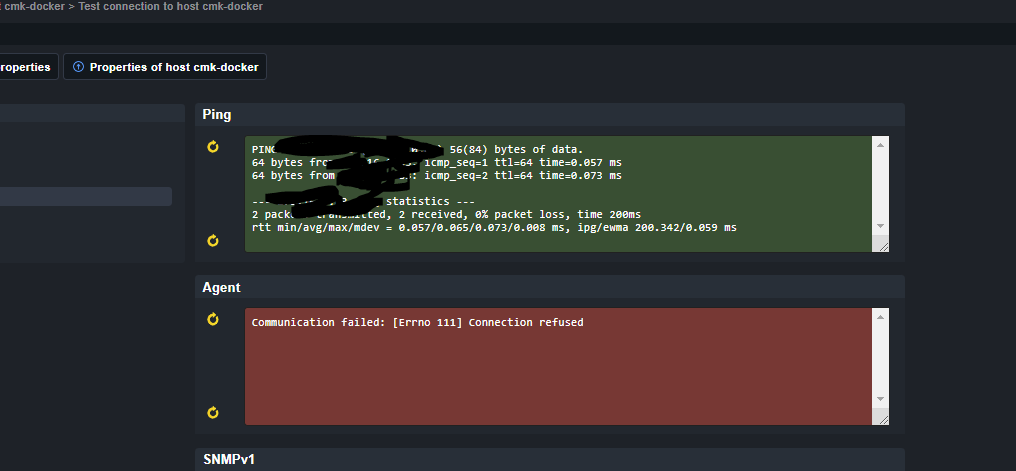
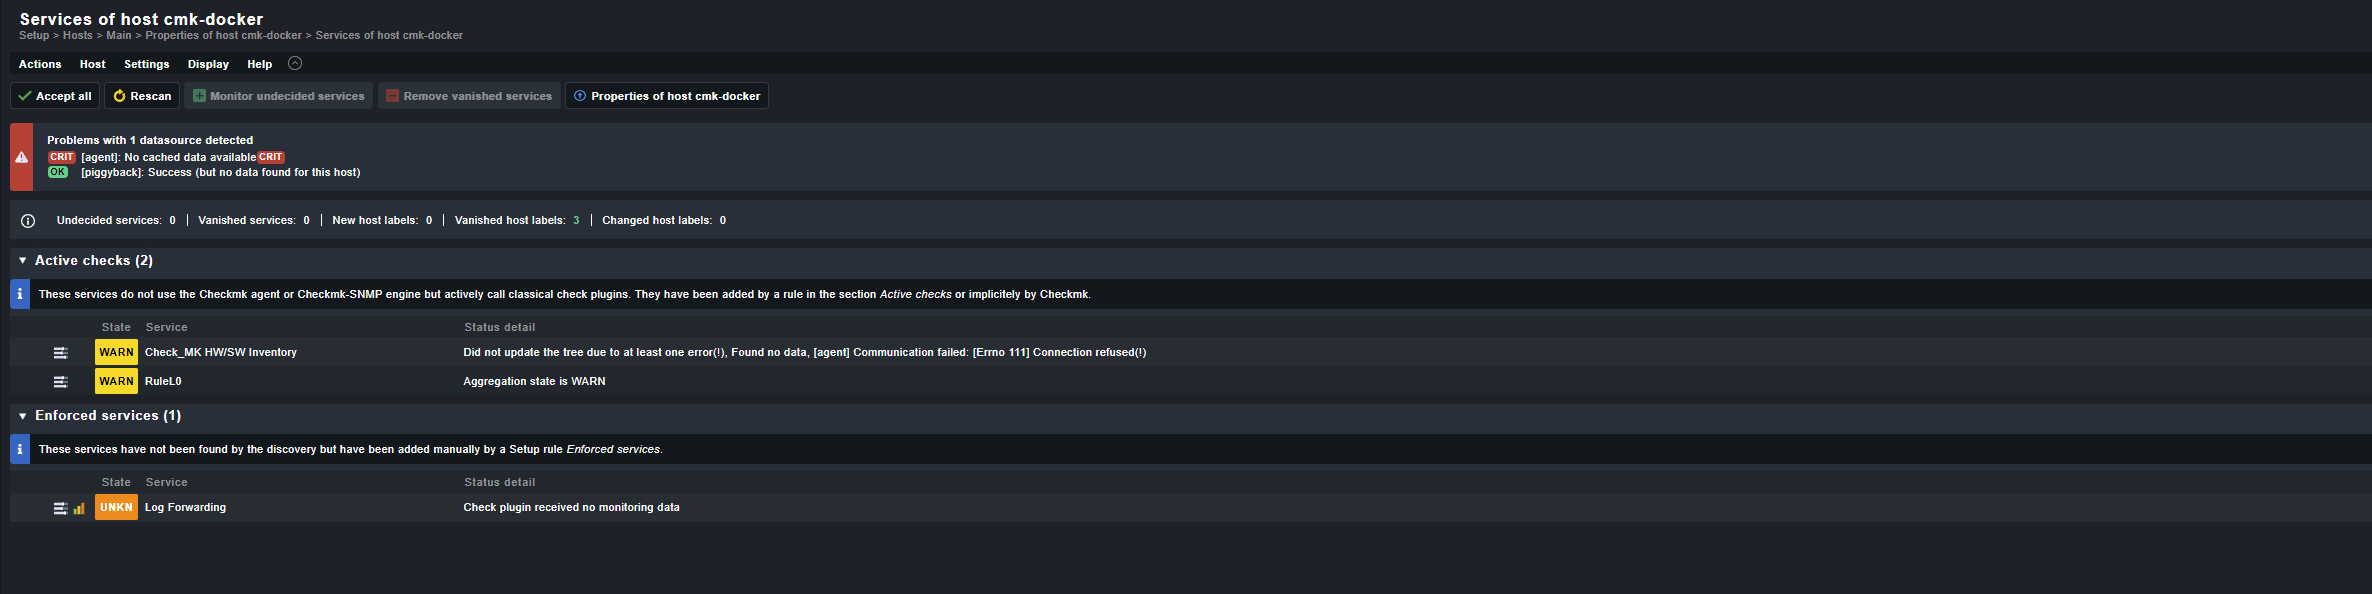
Checked Service and Agent Status:
The agent on running on checkmk server exits with err code 111 (refused to connect)
Reviewed Configuration Changes:
Checked recent configuration changes to ensure nothing was altered that could affect the graph display.
Checked Logs:
Reviewed the CheckMK logs for any errors or warnings but didn’t find anything conclusive.
Cleared Browser Cache:
Cleared the browser cache and tried accessing the dashboard from different browsers and devices.
Hi @flybug
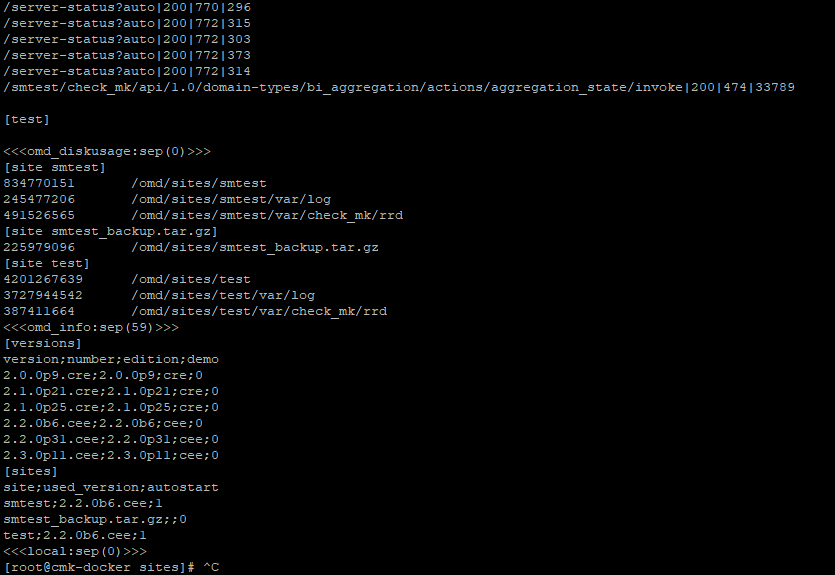
based on your screenshots. Is your Checkmk Server running as a Docker Container?
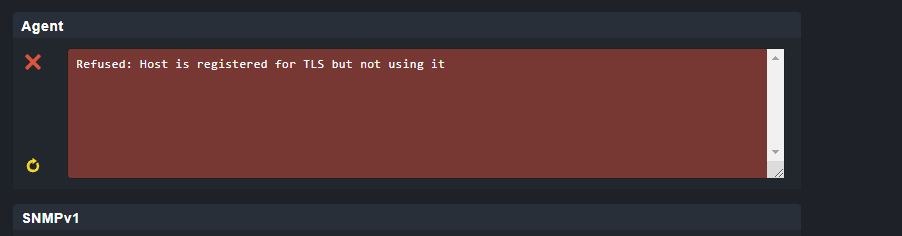
Your Checkmk agent seems to not be installed on your Checkmk server, or it is not running.
Since you have multiple sites. Did you maybe already registered (TLS) the host to a different site?
Please execute sudo cmk-agent-ctl status and check if you already have a connection there. If that’s the case, you have to register it to the other site.
This topic was automatically closed 365 days after the last reply. New replies are no longer allowed. Contact an admin if you think this should be re-opened.