To achieve that, we wrote “line” and “-line” as linetype in the graph’s definition (or “area” and “-area”).
However, with the new graphing API I could not find a similar setting.
To display a metric as a line, we add it to the simple_lines attribute of the Graph object and to display it as an area, we add it to the compound_lines attribute:
graph_my_graph = Graph(
    name="my_graph",
    title=Title("Some Title"),
    simple_lines=(     # displayed as lines
        metric_a.name,
        metric_b.name,
    ),
    compound_lines=(   # displayed as area
        metric_c.name,
        metric_d.name,
    ),
)
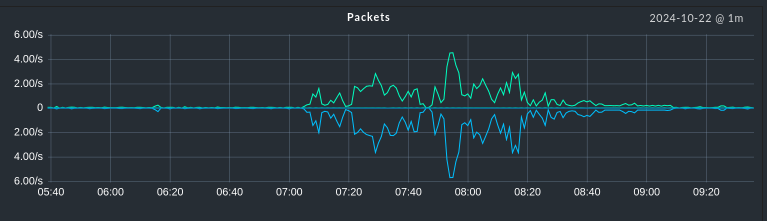
But how do I define a metric that is displayed below the x axis? I tried a combination of Product(my_metric, -1). This works and shows the values below the x axis, but it also shows them as negative values (for example, a bandwith is then -1 GB/s).
In the meantime I found the script ~/share/doc/check_mk/treasures/migration_helpers/graphing_v0_v1.py which converts “old” metric plugins into “new” graphing plugins. And after tweaking the import statements of an old plugin a bit, the script converted it to the new format and also made use of that Bidirectional(upper, lower) thingy.
How did you tweak the imports? The script fails with NameError: name 'metric_info' is not definedwhen it tries to import the libs under Checkmk 2.3 or just prints nothing.
The thing is that the tool can only handle directories and reads all files in that directory and then outputs all the metrics of all the files combined to stdout. So I wrote a little wrapper script that copies the old files one by one to an empty directory, calls the tool, collects the output and then empties the directory.
Thanks for the explanation. Worked good with the additional imports. And it only worked with one file in the working directory. I hope the documentation will improve on those APIs as there are still files dangling around as deprecated (like ~/local/share/[man|doc]/…).
This topic was automatically closed 365 days after the last reply. New replies are no longer allowed. Contact an admin if you think this should be re-opened.