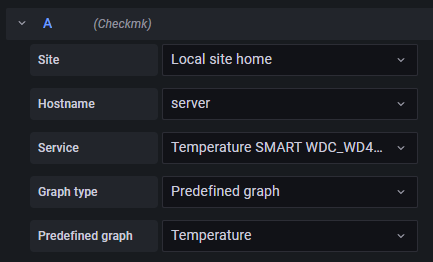
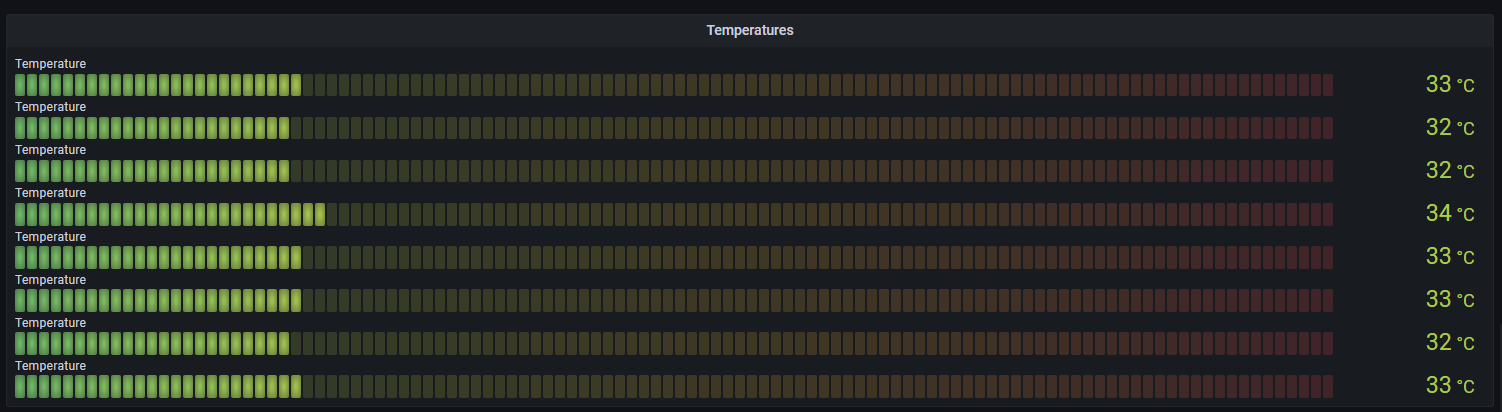
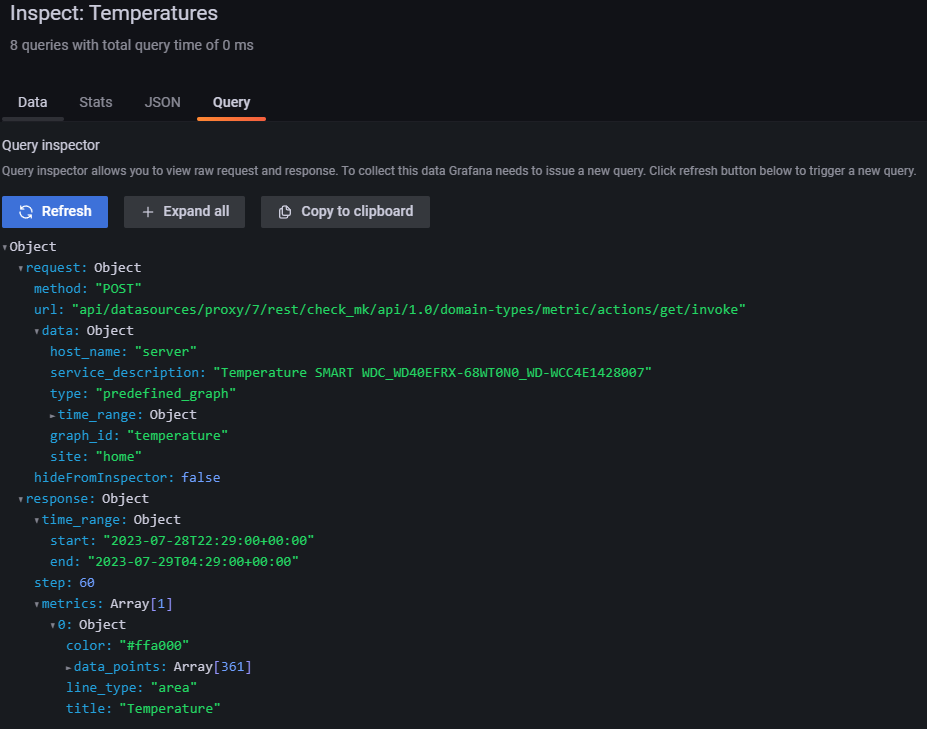
Looking at the query inspector, I can see there is a service_description for each query, I’d like to use this as the Display Name rather than the value name (Temperature):
i think you are affected by #60. it is currently not possible to overwrite the label that is provided by our checkmk backend.
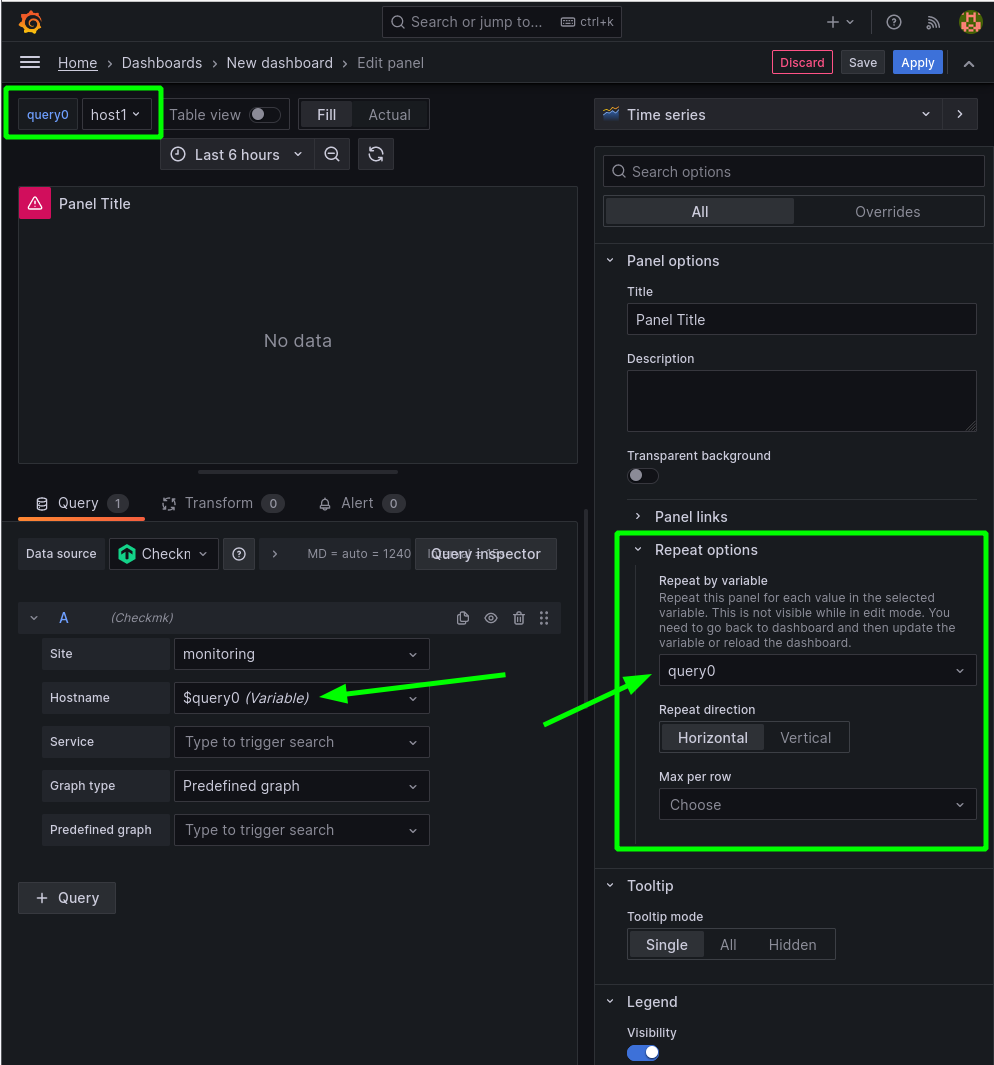
as far as i know (but i might be wrong here) there is no way to repeat the query by variables in grafana, but you could repeat the panel:
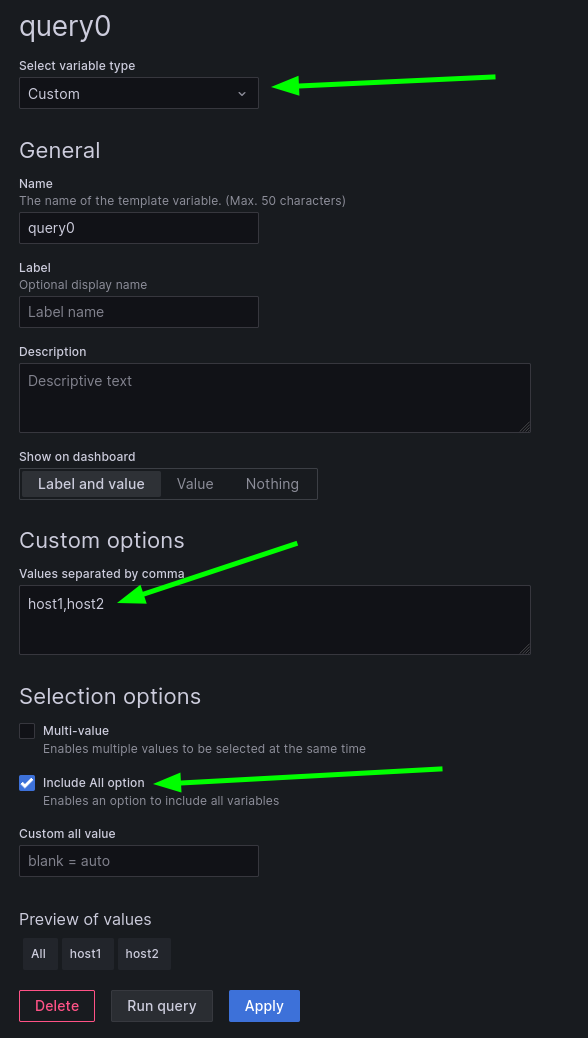
create a variable: you may use a query variable and ask checkmk for a list of hosts (select variable type=query, and choose the checkmk data source as source), but you may also create a static set of hosts as shown in this example:
Thanks for the reply. However that doesn’t exactly help me do what I’m actually trying to do. It seems to be exactly the issue you linked on Github. I saw godspeed-you’s reply, hopefully we get something working by the end of year as this makes the plugin unusable currently.
What would be really nice is tthe ability to use regex like with the Enterprise version… not sure what are the technicalities that prevent that from happening as it shouldn’t be that complicated to do programmatically (rather than just duplicating queries), maybe Grafana could also do more here to help us. This has been a big bottleneck for me too.
I just started using the variables now that’s it’s supported well by the plugin and it does work well and it’s great to generate dynamic dashboards. Appreciated feature.
This topic was automatically closed 365 days after the last reply. New replies are no longer allowed. Contact an admin if you think this should be re-opened.