CMK version: 2.1.0p13.cee OS version: Ubuntu 20.04.5 LTS
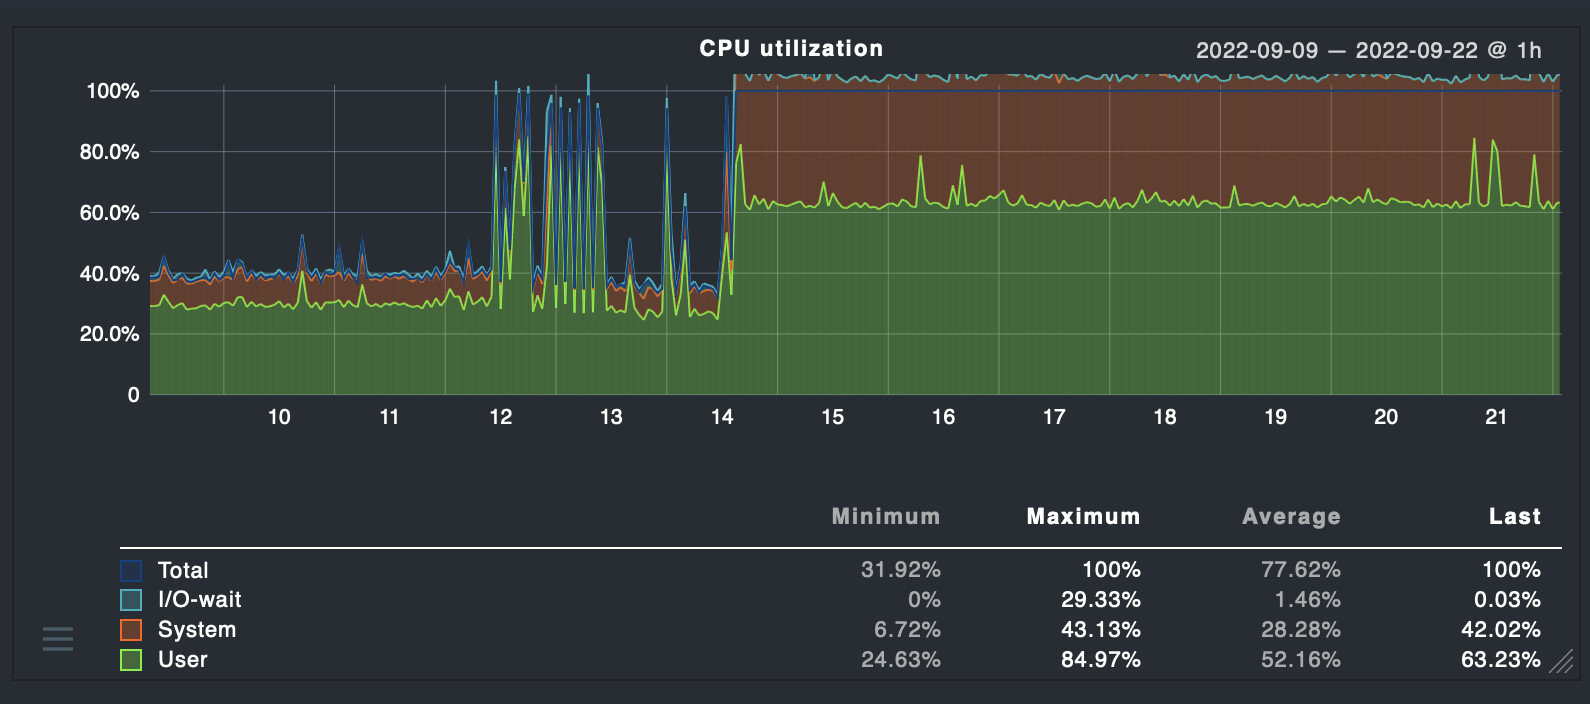
After upgrading to 2.1.0p11 from 2.0.0p23, CPU usage is pegged to 100%. Seems to be used by the cmc process. After a reboot, the cmc process spikes to using all available CPU within a few seconds. Just tried upgrading to the latest p13 release, with no change in behavior. How do I troubleshoot/fix this? Prior to the upgrade the VM was averaging 40%. No real changes were made the config around the time of the upgrade, only the addition of the “Check_MK Agent” agent checks that were introduced.
since there are not dozens of people reporting this, it seems to be a cmc issue in your environment - possibly still a bug, but you’ll need tribe29 to troubleshoot. So please open a ticket with them or your partner to troubleshoot this.
Pretty sure there’s a bug in the cmc core. Changed the host check interval to 5 minutes (from the 6 second default) and the service check interval to 10 minutes (from the 1 minute default), and cranked up the logging on the core.
After restarting the site, cmc cpu is near zero until the service checks run at which point in the next 10 minute block where nothing is being checked, it remains near 100 percent. Monitoring the process with strace/perf top, it appears that the process gets stuck in some infinite polling loop.
I’ve watched the logs for a bit and have seen 3-4 repetitions of this:
… during each check interval. Watched for a bit and determined that all of the hosts are physical hosts with IPMI monitoring enabled. Disabled IPMI monitoring for them, and while the fetcher pool is no longer crashing, the cmc process is still reaches 100% CPU. So while there’s a memory leak or other issue in the IPMI implementation, not the cause.
I’ll continue to try and narrow down what checks/active checks/services might be causing it, and then figure out how to open a ticket.
Only one suggestion/idea - is the IPMI check done with the management interface option inside the host configuration? If yes i would recommend to not use this broken function
On my bigger systems with actual 2.1 i had no such problems with CPU utilization like on your machine.
With a lot of trial and error, I think I narrowed the issue down to a folder with 10 battery backup units in it. Have reset all of the check intervals and so far we’re back to normal. Will let this sit for a day or two as-is and see what happens, but for the most part cmc is hovering around 1-2% CPU usage currently.
There’s nothing exotic about the UPS units. 7 APC units with AP9631/AP9641 cards and 3 Eaton units with their Network-M2 card. CheckMK is just doing regular SNMP v3 checks on them.
If this holds steady, I’ll start to enable them one-by-one and see if it’s limited to a single host.
Yes. Was using the management board option in the host config. I haven’t noticed any issues with it, other than noticing today that it was causing the helpers to restart. Checks were occurring as far as I could tell.
Alright, pretty sure at this point it’s related to the “Inline SNMP” polling APC UPS units. CPU usage had remained far more stable after disabling that folder, but would still spike after an hour or two (or sometimes almost immediately) following a restart. Realized I had two APC units not in that folder.
I’ve reenabled the folder, and have added a rule to force the classic SNMP backend for all UPS units. Have been good for the last 18 hours or so. Restarted the site several times, seeing normal CPU usage. Disabled the rule, applied, and within a minute, seeing high CPU.
Will spend a bit of time trying to narrow it down to see if the behavior is limited to APC NMC v2 or v3 and then file some bug reports.
This topic was automatically closed 365 days after the last reply. New replies are no longer allowed. Contact an admin if you think this should be re-opened.