CMK version: 2.4p34 OS version: Rocky Linux release 8.10 (Green Obsidian)
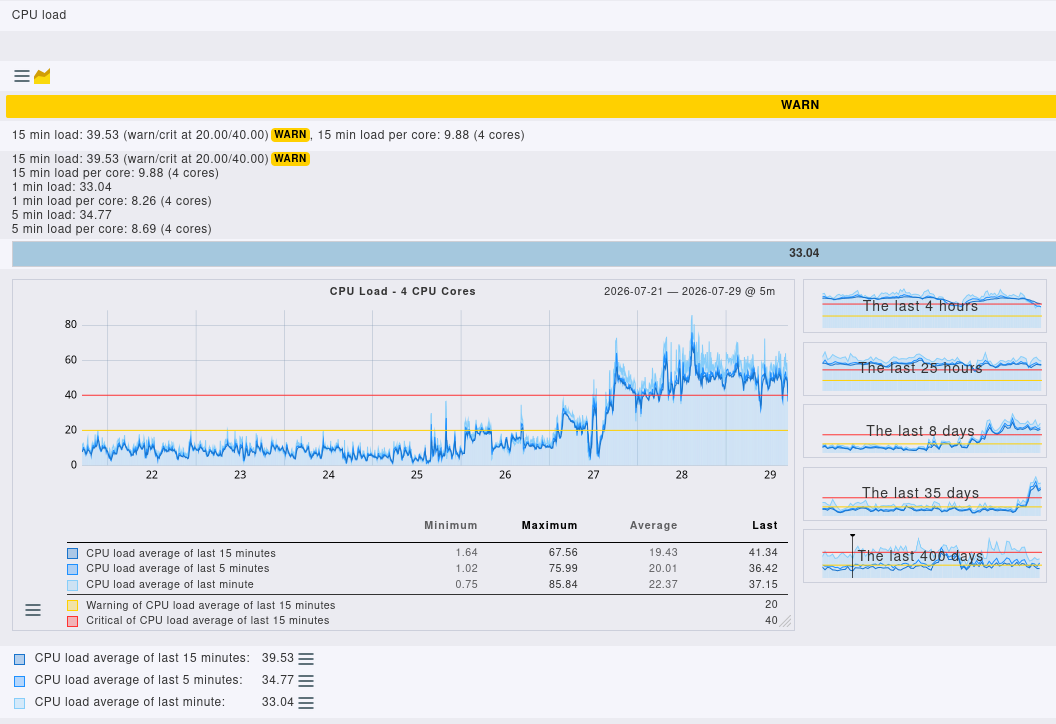
The affected machine is running as remote site and since the upgrade done last weekend the load average kept creeping up. The tens of processes look which appear to cause the issue all look like this:
This cascades into other issues, like internal timeouts seen e.g. on the central site which logs this error:
Could not connect to the remote site (HTTPSConnectionPool(host='slavecheckmk.example.com.au', port=443): Max retries exceeded with url: /mysite/check_mk/automation.py?command=ping (Caused by ConnectTimeoutError(<urllib3.connection.HTTPSConnection object at 0x7f24c4706bd0>, 'Connection to slavecheckmk.example.com.au timed out. (connect timeout=5)')))
Worth noting the central site is running the same 2.4.0.p34 version on Rocky 9.8 but it doesn’t show the excessive load issue, even though both instances are monitoring almost the same hosts & services.
Just to reiterate, in the previous 2.1.0p29 version which we ran for quite some time I haven’t seen this excessive load issue. Looking forward to what your thoughts are.
I see, thanks. On the affected machine the CPU usage jump is more than 200%, from loadavg ~15 to 40 or higher? Again, all those long running processes are pointing to /omd/sites/mysite/var/check_mk/core/helper_config/latest/host_checks/
Thanks, I can try Jaeger, where can I read more about how this should be configured? It’s unclear for me reading Werk #16565: Introduce distributed tracing of Checkmk how that’s supposed to work, some extra pointers will be much appreciated.
On a single site setup you only have to configure the Jaeger trace send and trace receive ports to the same port and send to localhost. Unfortunately there is no Werk for the initial integration of the single site Jaeger setup.
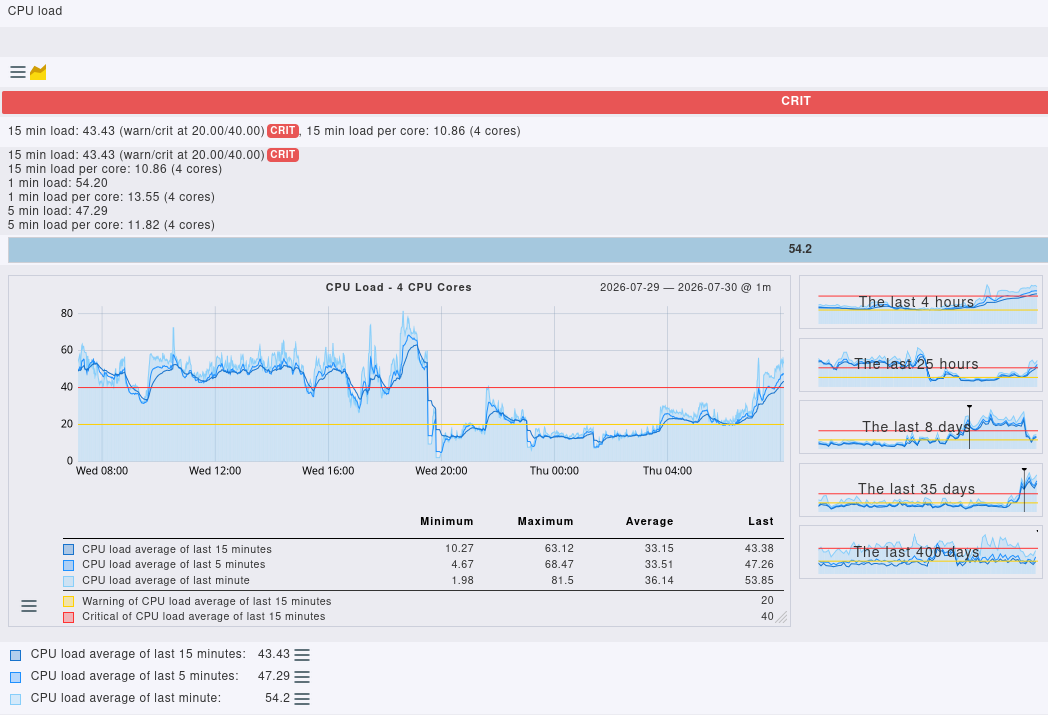
This issue may have been caused by patchy IP connectivity to a specific subnet monitored. After fixing the connectivity it appears the CPU load has dropped to the normal levels. Will keep an eye on the status. Sorry for the noise, it’s got nothing to do with the upgrade or the version per se in this particular case.
I would give one more advise. The machine was before the update already overloaded. You have 4 cores and the load before was already sometimes 20 that’s way too high for a good monitoring performance.
Agreed on the machine load, can do with faster hardware, it’s on my radar. To follow-up: the high loadavg returned, fixing the suspected network connectivity didn’t help, another screenshot attached.
Yes i expected this behaviour. Also without the networking problem the load is around 10-15 in average. This is way to high for 4 cores. In your current situation the load keeps increasing as more and more processes wait to be processed. This results in timeouts and process rescheduling, which in turn leads to even higher load.
This is something like a death spiral for the system.
If it is a VM give it 4 or 6 more cores and all should be fine.