Hi everyone,
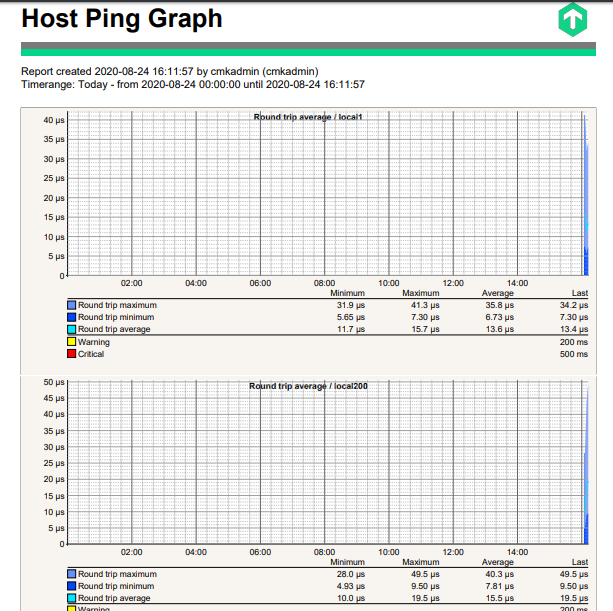
easy question in theory - but up to now tricky in solving… Is there a simple way to query (and export) Host Graphs (like round trip average), let’s say for all hosts for a given WATO folder (alternatively, all hosts using a certain host tag) - and on top by scaling to “the last 35 resp. 400 days”?
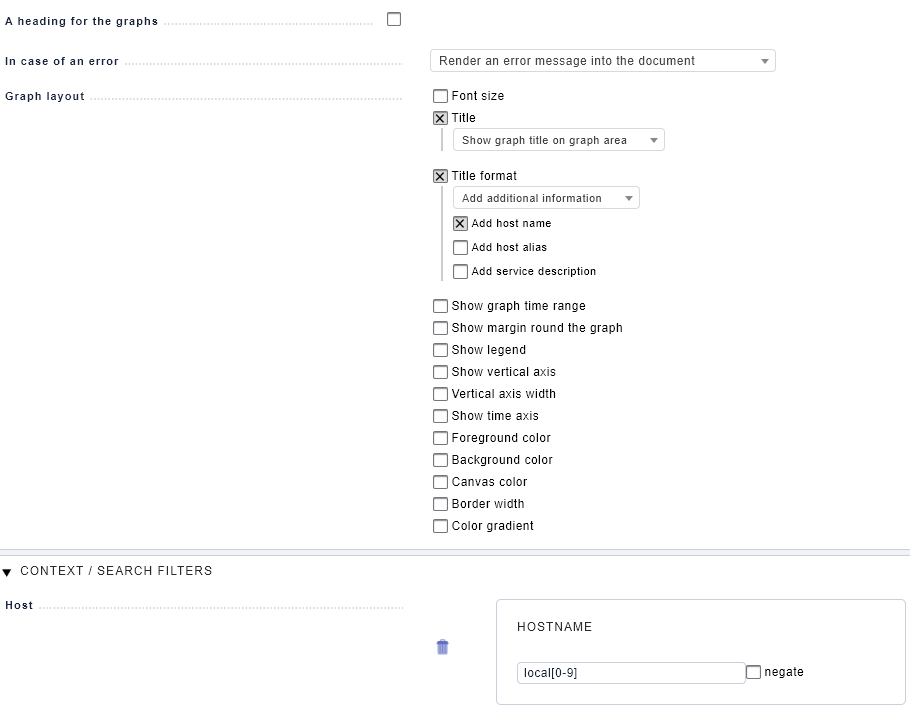
In the reporting tool so far I found no possibility to define “host graphs”.
Next, performing a host search and continuing via “Combined graphs…”-button is helpful only partially: additional “filtering” based on lines/stacked/min/max/average will merge a lot of information into one pretty colourful plot; however, some 25+ hosts are hard to distinguish when scaling to 400-days-timeline…
Anyone got a clue how to solve that? THX!