Hi,
Is there any way to create only host group summary reports for a particular time period?
Thank you
Hi,
Is there any way to create only host group summary reports for a particular time period?
Thank you
Hi @ETSystems
what do you mean by “host group summary reports”?
A report (e.g. for availability), that only shows the average value for the host groups, but not the individual hosts of each group?
or
A report that is filtered to one host group and presents some kind of “summary” of this group?
I am looking for this option.
Alright, what should that summary contain?
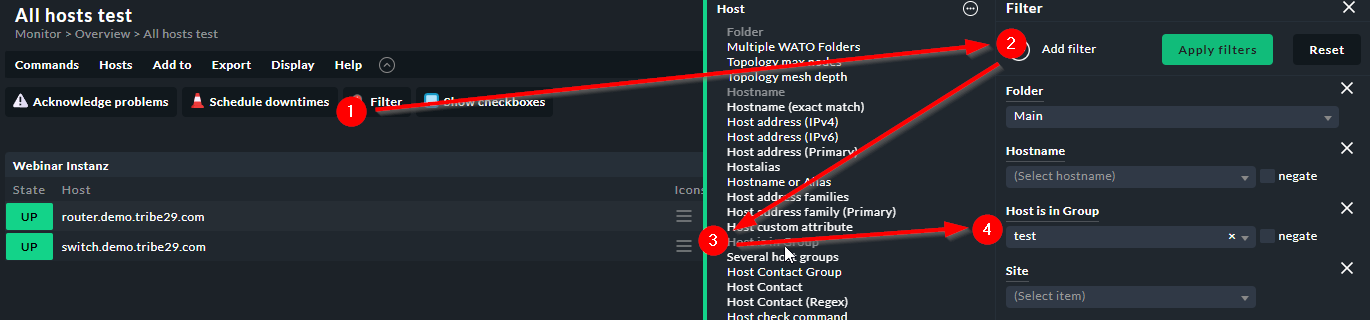
In principle, you can filter every view to a host group using the normal filter mechanism (and then export the view as PDF).
You can also build report templates that can be filtered to host groups
In case you haven’t read it, this article is probably a good starting point: Reports
hi @elias.voelker ,
sorry, I don’t know if my request was clear to you.
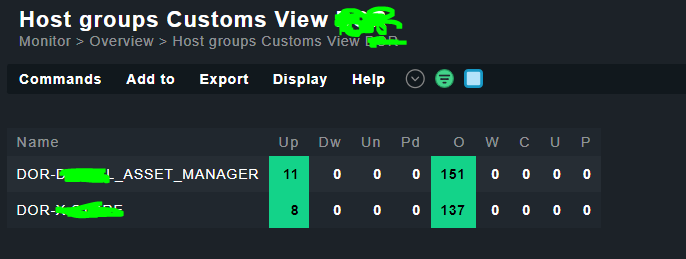
I want to create an availability summary report of Hostgroup without the hosts’ details.
I created a view as I required but when I try to export it to pdf, I cannot filter it based on a time range for eg, a summary of the host group in yesterday’s time range.
Ah, ok. Then I did misunderstand you.
I don’t think this is directly possible.
There could however be a workaround, by adding the hosts of that host group to a BI aggregation and then report on the availability of that. But let me confirm that.
Thank you.
I tested BI aggregation also. but I am confused with its setting,
No, this is the aggregation function. This will determine what state the aggregation takes.
There are three types of aggregations:
Best - the node takes the best state of all its branches. Example: You have three load balancers. The aggregation looks across those three and picks the best state of the three. So if 1 is OK and 2 are critical, the node will be shown as OK
Worst - the node takes the worst state of all its branches. Example: You have three load balancers. The aggregation looks across those three and picks the worst state of the three. So if 1 is CRIT and 2 are OK, the node will be shown as CRIT
X out of Y - you can determine what share (in percent or in absolute terms) you deem ok. For the load balancer example, you may want to say: If 2 out of 3 are OK, the node should be OK, if 1 out of 3 is OK, you want it to go to WARN, if 0 out of 3 are OK, the node should be shown as CRIT
Now you can translate this aggregation logic to your host group. What is the “summary state” of this host group? Is it best (as long as one host in the group is ok, the group is ok) or something else.
Note: This will of course not give you the arithmetic average of host group. For example, if you have one host with 100%, one with 95% and one with 75% availability → the BI aggregation will not be shown as 90% available (which would be the arithmetic average). It will show you 100% if you chose “best”, 75% if you chose “worst”, and 95% if you chose 2 out of 3.
Does that make sense?
This topic was automatically closed 365 days after the last reply. New replies are no longer allowed. Contact an admin if you think this should be re-opened.