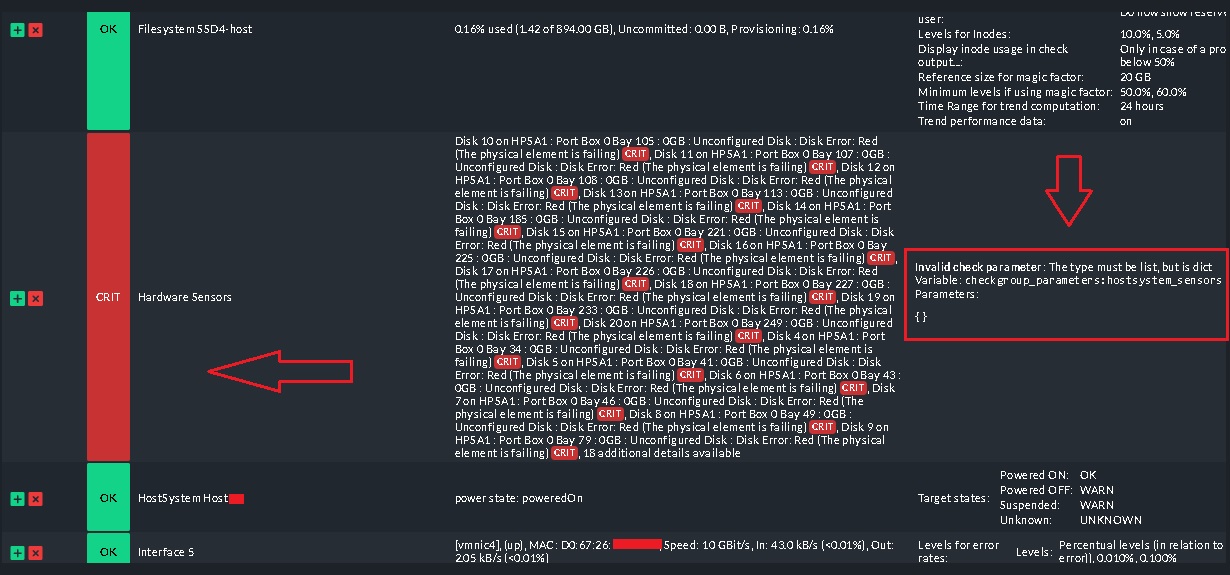
I have added my ESXi host to checkmk and it is monitoring but there is one issue . According to follow pic one of the items cannot get correct data and according to description I have to change parameter type to list . How can change it to get and show correct data ?
Not really the answers to your question, but the cause of the error you have is a problem in HPEs CIM Provider which they are not going to fix.
I opened a Support Ticket at HPE and they said, that they are not going to develop a solution and you should use the ilo Board for Hardware Monitoring.
The workaround for checkmk is to disable the ESXi Hardware sensors check and check the hardware with the ilo management checks through snmp or Andreas Redfish plugin.
Hi there!
First: Happy new year! And here is also an answer that may do not match your question but maybe it can be a solution? I’m monitoring the hosts of our ESX Clusters via the vcsa and use the collected piggybag data from the vcsa without to ask them directly. Looks like this
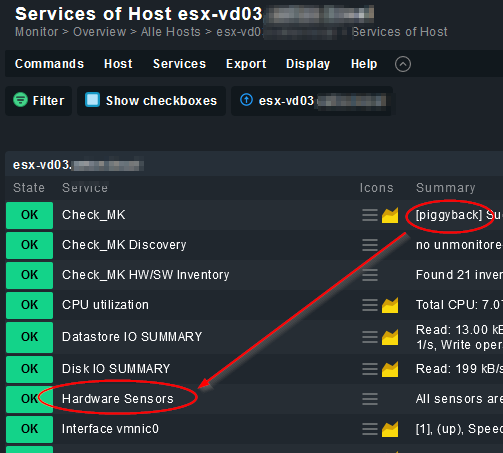
In case of one or more Problems of the HW-Sensors it will appear as critical warning.
Best regards
@eins.elf
Thanks. But I have added hosts directly to checkmk and I cannot find piggyback on that . Is that possible add this rules to host ?
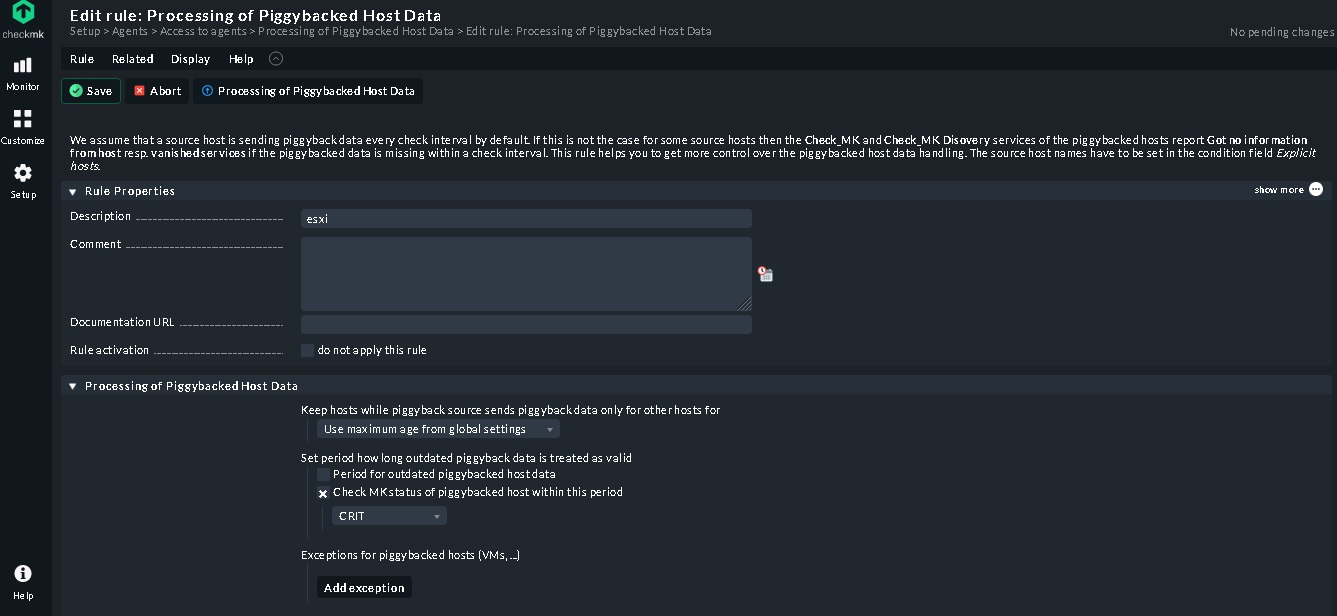
Also I added follow agent rule but not changes and still show critical error
Hi!
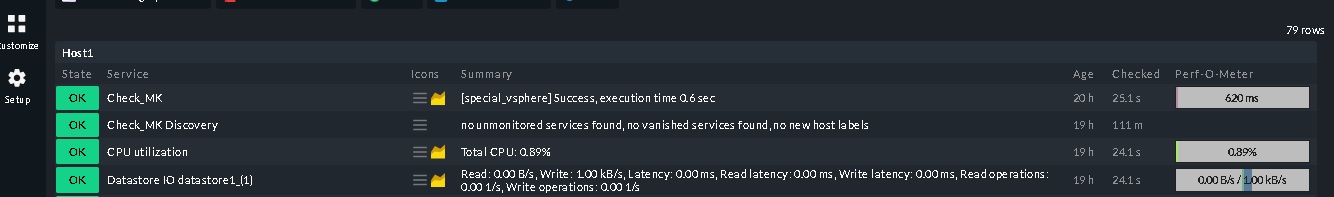
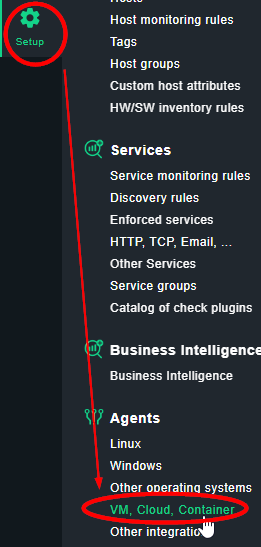
Here is some Doku about monitoring vcsa / esx hosts. My way is to create a readonly user on vcsa, edit the rule “VMware ESX via vSphere” by using this user to access the API. Then add the ESX-Hosts without agent and without snmp, but with piggyback. So you monitor only the vcsa, but got all Information of all ESX-Hosts of this ESX-Cluster.
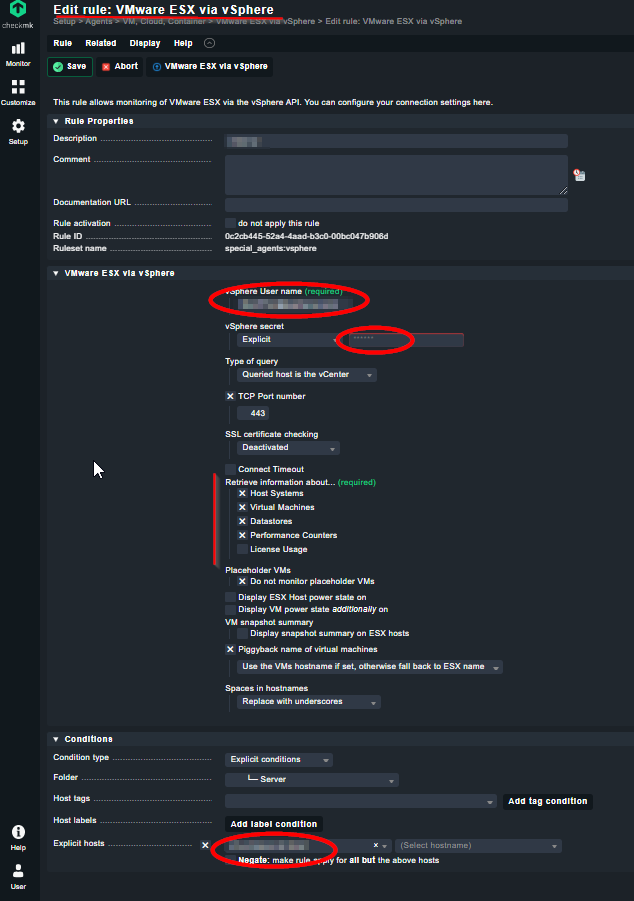
Additional you can add seperatly the imm / irmc by monitoring with snmp to get additional Information about Power, FAN, MEM. CPU, etc.
Maybe this is not the perfect way, but in our case it works great an gives us the needed Informations about our systems.
Best regards
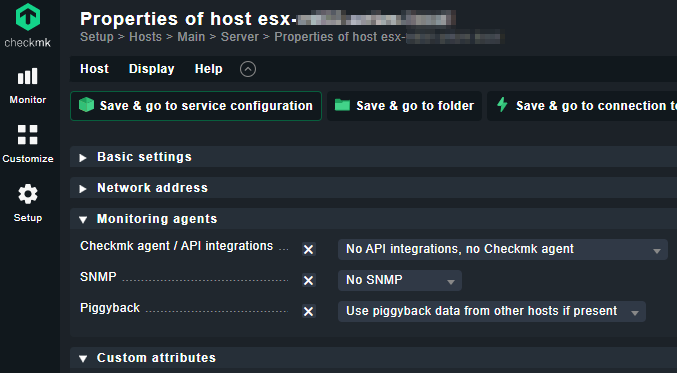
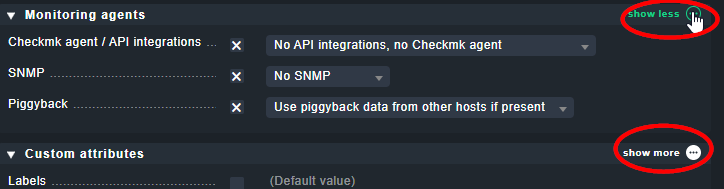
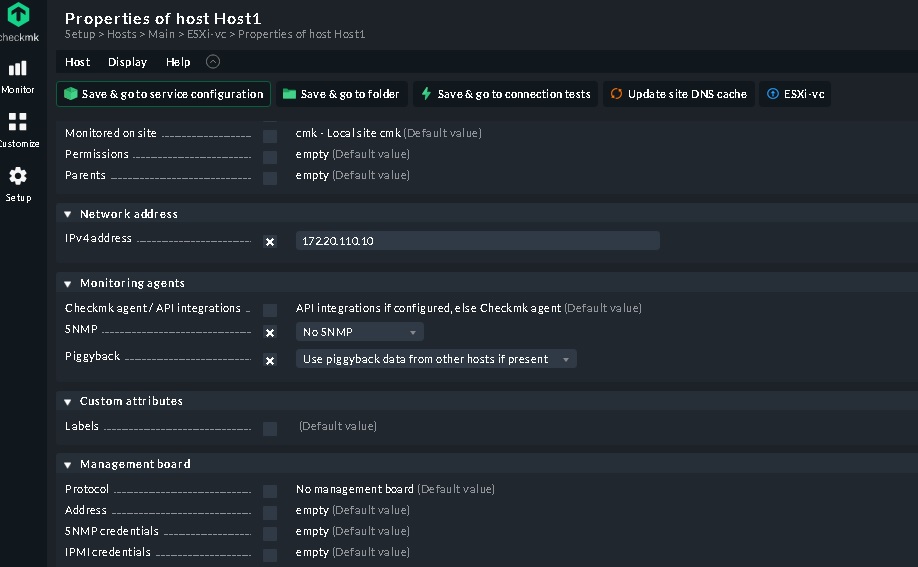
Please see follow pic . there is not any option such as Piggyback in monitoring agents part in checkmk .
What is the issue ?
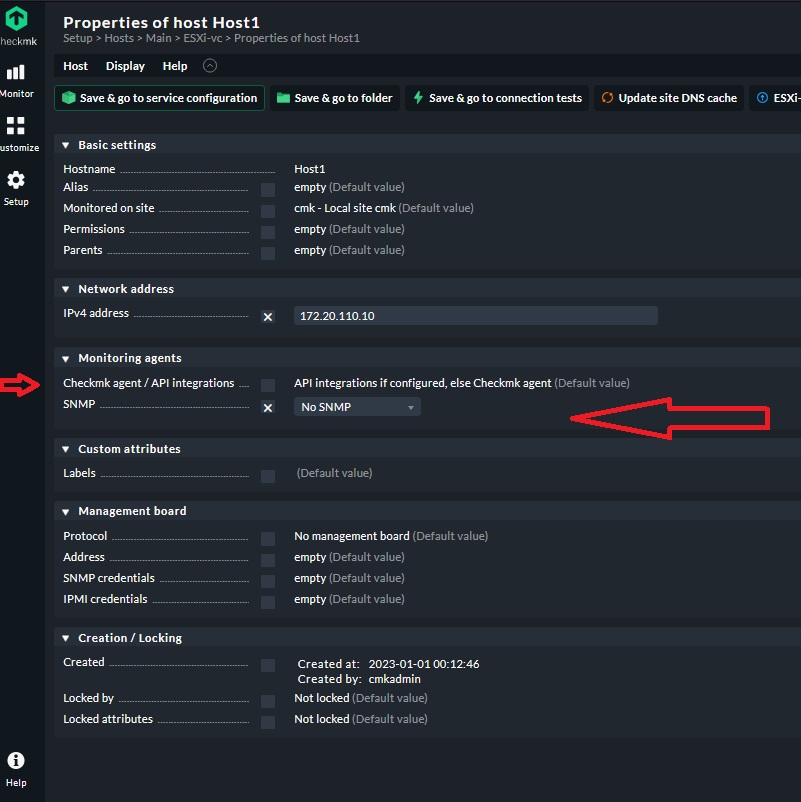
Thanks. I enabled it but it is piggy did not add to checkmk agent
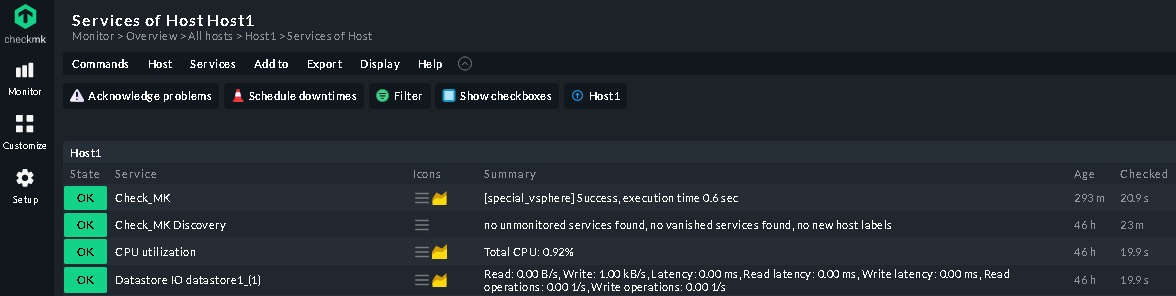
Also according to follow pic the issue did not solve
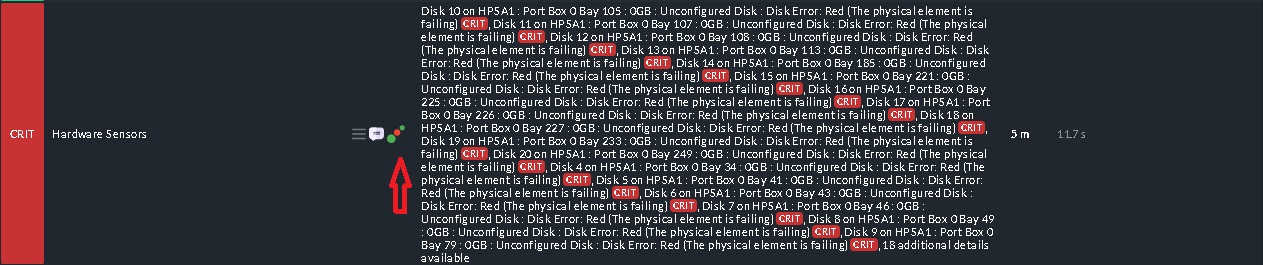
But the status is flapping sometimes is green and OK and sometimes change to critical (most of time is critical) and when click on notification shows follow
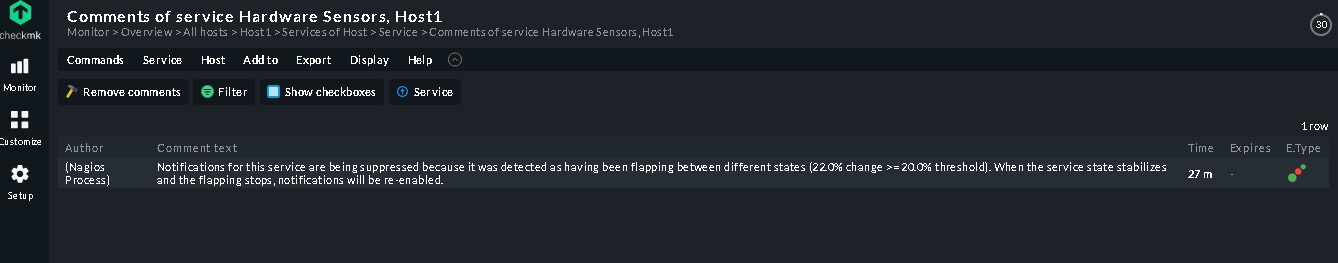
Hi.
Maybe the flapping depend on a short check interval? How much Hosts / Services you are monitoring? We are monitoring 300 devices and more than 6000 services. We decided so decrease some intervals, because we had also performance problems (also sometimes flapping). If you want to test, you con define a rule only for the ESXi HW. In our case we decreased to 1min 40.
Best regards

As I wrote earlier - the problem is, that your esxi OS does not get the correct hardware info from the physical server.
You will see the same disk errors in the vCenter GUI in the hardware monitoring storage tab, what means that the API of the ESXi or vCenter is presenting wrong data to checkmk.
There is no way to really fix that problem on the checkmk server side (besides disabling that check)
If you want to monitor the server hardware, use the ilo of that server.
See this post
This topic was automatically closed 365 days after the last reply. New replies are no longer allowed. Contact an admin if you think this should be re-opened.