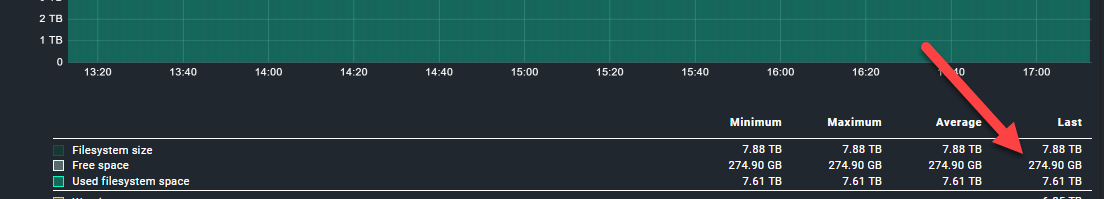
I need to show the FREE filesystem disk space in MB/GB or TB in an overview dashboard (copied from the Linux overview) and on the detailed dashboard for the server.
The data are available in the graph, but I haven’t found a way to integrate them into a single metric or the overview table.
Any ideas on how I can solve this need?
Thanks for the quick answer. I’m using the CEE but I only need the value of free space. The value is in the standard graph. but I cant get it into a single metric like for example:
Maybe you have an idea of how I get this out.
The reason for that is as the operation team is importing databases into the server. And they have different sizes so they need to know if they still have space on the server or if thy have to use another one. And it’s much easier to see how much space in MB/GB or TB is free.
Ok, that requirement is not easy to handle. The free space, that you see in the graph, is calculateted in the graph definition like this ("fs_size,fs_used,-#e3fff9, "stack", _("Free space")),, but the dashboad element use only raw metrics. What you can adapt is, to write your own perf-o-meter based on examples in lib/check_mk/gui/metrics/perfometers.py. Look at the definition of fs_used(%) and you will find the solution. For the other stuff, you need to write the fs_free as raw metric.
This topic was automatically closed 365 days after the last reply. New replies are no longer allowed. Contact an admin if you think this should be re-opened.