I use dpkg -i to install uemcli package and now it is showing
root@checkmk:/# uemcli -d 172.2.2.2 -u Monitor -securePassword -sslPolicy store /sys/general show
Password:
Storage system address: 172.2.2.2
Storage system port: 443
HTTPS connection
1: System name = CKM00182901751
Model = Unity 600
Platform type = EMC Storage System
Product serial number = CKM00182901751
Auto failback = on
Health state = OK (5)
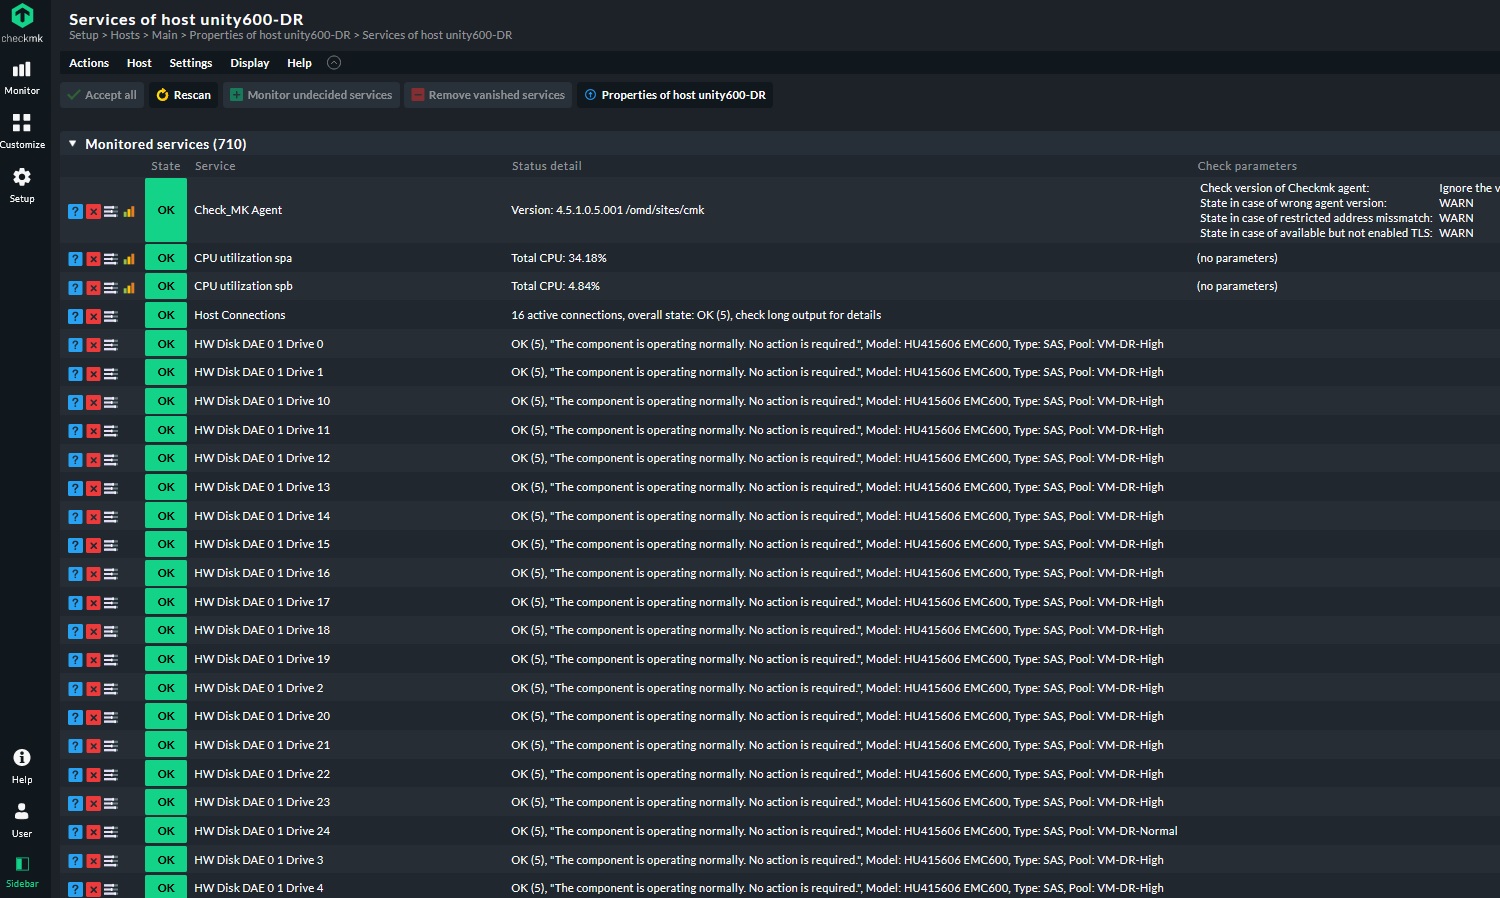
The output looks like it is on my system. The permission messages are ok as inside the mkp the files have the “wrong” permissions and CMK correct this at activation time.
The file responsible for the setup menu items is also there.
Thansk. As I said the issue solved Actually I used sudo command for use mysite user but now login mysite user with omd su cmk and install mkp and the issue solved . Another thanks from you
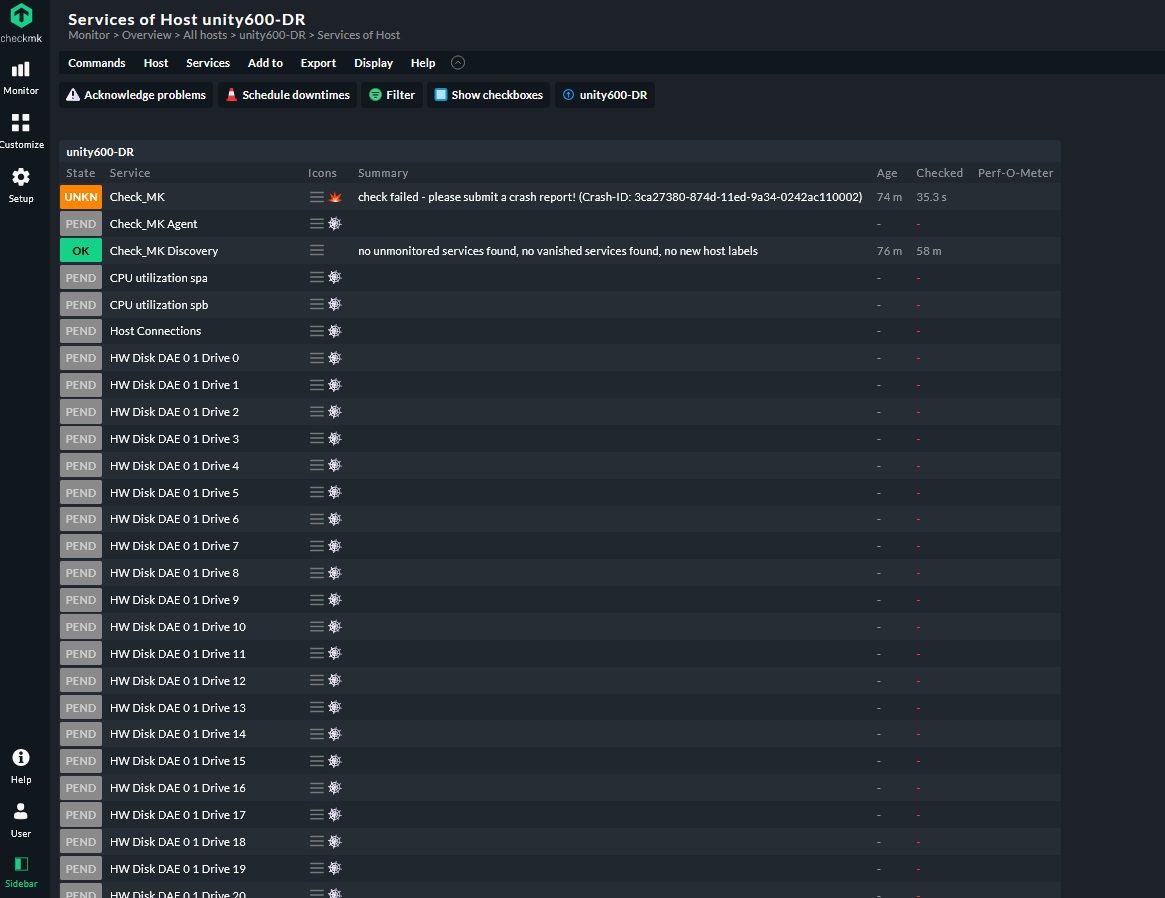
looks like there are multiple special agent / datasource integration rules that apply to your emc host, please check the rule “VMware ESX via vSphere” - I guess there is at least one rule in there, that has conditions which also match your EMC host.
Just one question Is there other plugins that can use for monitor EMC unity ? Or is that possible add some items to this one ? for example I am looking for that plugin or rules such as Datastore IO that can that can show Read/Write latency or IOPS for each disks and LUNs . Is there any solution for that ?
You can always expand the existing plugins with stuff you write on your own. For that, you just copy the plugin into your /local folder and make the modifications there. If it detects a plugin of the same name, Checkmk will always take what’s in your local over the default plugin
Thanks. As change for EMC unity plugins is not easy process I just want to know is there any solution to get latency from physical disk or LUNS ? Also I added Disk IO discovery rule but it does not work for EMC unity disks and it works only for ESXi disk . So Is there any plugins or extension for that ?
Is there any solution to get disk latency on EMC unity . Because this plugin just can detect disk status , fan status , sp status , … and does not show any info about IOPS or latency on disks or LUNs
This is not so easy to answer. First you need to check with the EMC documentation if this data can be fetched with some commands like the other ones used inside the agent.
Or better said is it possible to use uemcli to get this data.
If you can answer this with yes, next step would be to extend the agent and produce a sample output.
After this is working it is needed to create a check inside CMK that uses this new output and produces some check results.
As i wrote before now you need to extend the existing special agent with the found command.
Inside the agent from line 102 onwards you see the different commands the agent uses.
Also you see two metrics commands.
Here you need to insert your commands and define the section name the newly created data should have.