Hey there,
I’m trying to setup a website showing detailed information about some services on a host. For this example I’d like to get some of the information that is available on the dashboard.
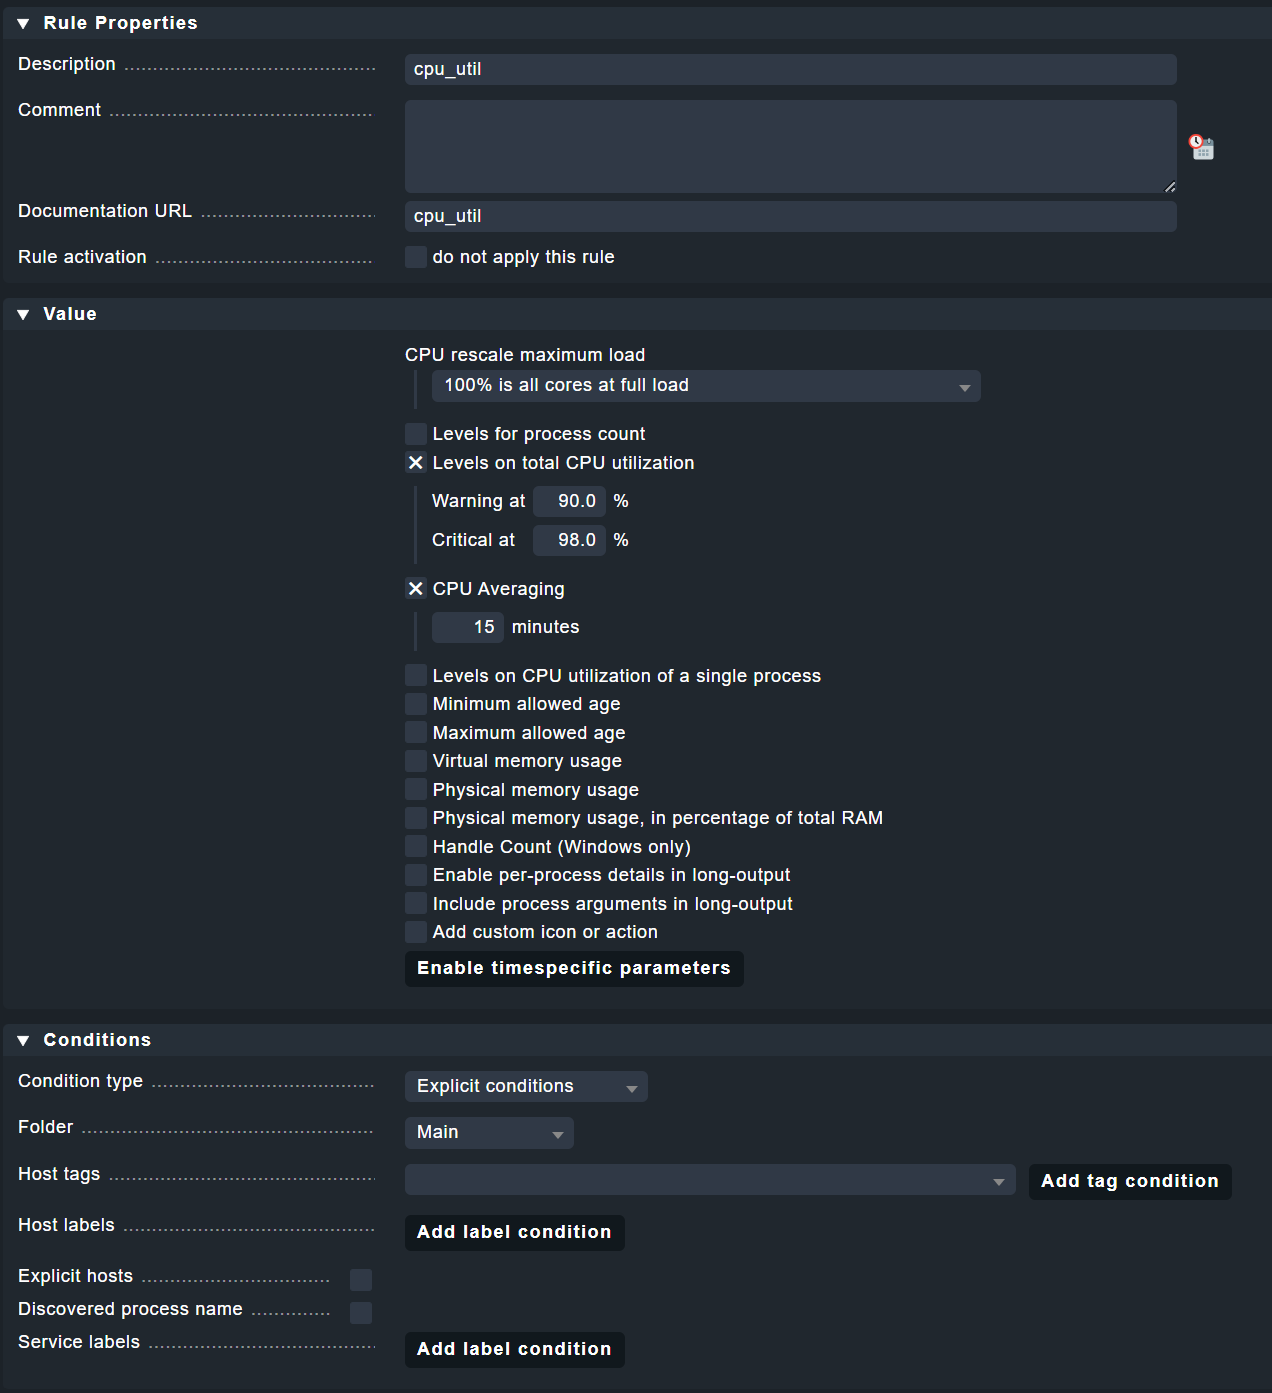
Consider instead creating a rule for “State and count of processes”, then for the matching process of that rule you’ll get “CPU Utilization” graphed as one of items.
Would you mind going about your solution in more detail and explain how that solves the issue? Maybe show an example? I just started using check-MK so I’m not sure what you mean by “CPU Utilization graphed as an item”.
I created a “State and count of processes”-rule, but then what? Applying the rule to the main folder doesn’t change the outcome of my GET-Request. Chances are of course, that I misconfigured something - so an example would be great.
See the Conditions section. Select the specific Host (or not if you have liked named processes across hosts) and the Discovered process name (this is to match the program running on the host).
Is that enough to go on? Play with that and see if it works for you.
I’m trying to access the services of the host. Things like memory, cpu utilization and such. I’ve tried around a ton now with setting a rule, but it doesn’t seem to work either way. Is a rule really the way to go?
I’ve also tried using the Web API now since apparently the documentation states:
However, there are a few features in the Web API that the REST API currently lacks. Since this is the present situation, you will find a comparison of the functionalities of the REST API and Web API in the last chapter of this article. The last missing functionality in the REST API for accessing sites in distributed monitoring and metrics and graphs will be delivered in Checkmk 2.1.0 patch versions.
With the Web API I atleast can return rddata and graphs. Is there NO way to get perfomance metrics from the current API? Just the current CPU load or RAM usage would be enough. It’s really odd that something so major would not be implemented yet. If you have any working example of how you use the current REST API to fetch some data about a running service, that would much appreciated.
Consider the following, fill in for YOUR-HOST and YOUR-SITE for your checkmk monitor and TARGET-HOST for the host whose CPU utilization you want. You’ll need to supply an Authorization header with “Bearer YOUR-AUTOMATION-USER YOUR-AUTOMATION-PASSWORD”:
This topic was automatically closed 365 days after the last reply. New replies are no longer allowed. Contact an admin if you think this should be re-opened.