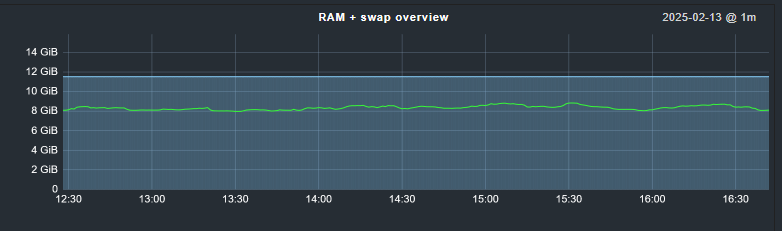
Why on the second chart Total RAM is decreasing? I have total 192 GB RAM and now it shows only ~140.
What will happen with the second chart if my percentage RAM usage will be like ~90%? Looking at the second chart it looks like there are almost no RAM.
What about available RAM? Why there is only free RAM on second chart?
Sorry for so much questions but I’m pretty new in monitoring services, thanks for your responses!
When I use the free -h and add together used and free, I get about the same that Checkmk reports as “total”, but it’s missing the columns shared, buff/cache and available.
Example from other server than the charts above.
$ free -h
               total        used        free      shared  buff/cache   available
Mem:            11Gi       5.1Gi       3.3Gi       200Mi       3.3Gi       6.1Gi
This topic was automatically closed 365 days after the last reply. New replies are no longer allowed. Contact an admin if you think this should be re-opened.