Hi, I installed check_mk and installed the ubuntu agent on the server where check_mk is located, so far so good and I see the discovered services.
I wanted to add a check on the log file /var/log/message and the capacity of the /tmp directory.
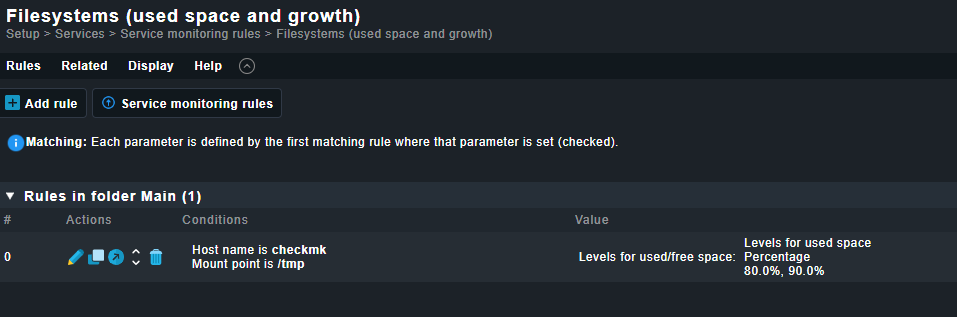
I added a new service from the services tab “Setup > Services > Service monitoring rules > Filesystems (used space and growth)” and added the service as follows
If you want to check more than the Agent returns as Default, you will need a Plugin.
To check /var/log/messages you can use the Logwatch Plugin. I described that in this Video:
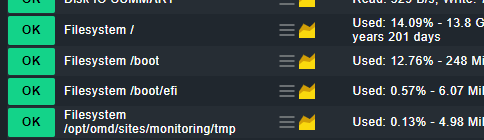
Capacity is automatically monitored for all file systems. So if you mounted /tmp as an own partition, it would appear as service. There is also a File info Checks where you can count Sizes of Files in certain directories, but for your use case, I would recommend an own /tmp partition.
The Rule you have found is then for the Threshold for this Partition, and therefore will currently not work.
ok, last question, now I am using the free edition and I know that after the 30 days it will be with the same functionality as the enterprise, but limited to 25 hosts and a total of 750 monitored services, can you confirm me these numbers?
possibly is it possible to downgrade later to the raw version without having to reconfigure the hosts and what would be the services of the raw?
Thank you
The Hosts are not limited, but the Services are. But on average, it will be about 25 hosts.
You can change anytime to RAW, but you will lose your History and Metric Data since the corce changes from cmc to old nagios. Services will still work.
There can also be a hiccup on the downgrade, where you need to use omd config to set the core.
The RAW has no limits, but therefore the core is Nagios which, on the other hand, is a limit (performance, speed). Also, there is no Agent Bakery and no reporting.
This is because you mounted the /tmp as a ram disk, is this really intended?
Because this can bring troubles when rebooting etc. That the site ~/tmp is a ramdisk, has diffrent reasons. And the Site ~/tmp is not the system /tmp
This topic was automatically closed 365 days after the last reply. New replies are no longer allowed. Contact an admin if you think this should be re-opened.