How to best setup custom checks?

Hi there

I am trying to migrate from a regular nagios where we have a lot of custom checks.

It’s a bit “convoluted” way to set this up in CheckMK :wink:

I have installed the Raw version on a clean Ubuntu 24.04 to test… (not sure if the Enterprise version is any different in this regard)

I have installed the check_mk_agent on the server.

I have then tried to copy a test script into /lib/check_mk_agent/local/ but as far as I can see as I try to discover it as a service it just executes the script, and we need to feed the script some variables…

So I find /etc/check_mk/mrpe.cfg where you can configure services… only thing is that these are “static” options ?… so if I were to check disk space, I would have to set the warn and crit calues here? Which isn’t very helpful… (I know check_mk has its own check for this).

On top of this, we have a lot of other checks which actually connect out to other hardware and pull out data, so we have to feed it a ip/hostname etc.. and we have several of these hosts using the same scripts… are you supposed to set this up in the mrpe.cfg file, and create a “service_host1 /usr/local/bin/checkhost -H host1 …..” ??

As an example, these are the most important scripts we need to migrate to Check_MK… they return Nagios status etc. and have worked very well with our existing Nagios setup…

(and we are aware that Check_MK has a plugin for NetApp storage system, yet we would prefer to use this as it is better and can do more detailed checks…

Now I have been looking at the docs and in the forums for half a day now, and I have still not found a good guide of how to set this up… :wink: maybe it’s just me…

I hope someone can point me in the right direction, and please remember I am still new at check_mk… :slight_smile:

/B

Hi Heino,

welcome to the Checkmk community! Great question — and a very common situation when migrating from Nagios. The key is understanding that Checkmk offers three different mechanisms for running Nagios-compatible plugins, and each serves a different purpose. Let me break them down:


1. Local Checks — NOT what you need here

You correctly identified the limitation: local checks are executed by the agent without any arguments from the Checkmk server. They are designed for simple scripts that determine their own state directly on the monitored host.

As the docs describe, local checks are called parameterlessly — the script itself contains all logic and thresholds.

Source: Local checks

For your NetApp checks that need -H hostname -w 80 -c 90 style arguments, local checks are the wrong tool.


2. MRPE — Nagios plugins with arguments, executed on the agent host

MRPE (MK’s Remote Plugin Executor) is the direct Checkmk equivalent of Nagios NRPE. It runs the plugin on the monitored host with full argument support.

Configuration in /etc/check_mk/mrpe.cfg:

NetApp_Aggr   /usr/local/bin/check_netapp_rest -H 192.168.1.10 -w 80 -c 90
NetApp_Vol    /usr/local/bin/check_netapp_rest -H 192.168.1.10 --check volumes -w 70 -c 85

Yes — this means one line per check per host in mrpe.cfg. For many hosts with the same checks, that means many lines. This is the NRPE equivalent: it scales the same way Nagios NRPE scales.

IMPORTANT: Do NOT place Nagios plugins in /usr/lib/check_mk_agent/plugins/ — that directory is reserved for agent plugins. Place them anywhere else (e.g. /usr/local/lib/nagios/plugins/) and reference the full path in mrpe.cfg.

Source: Monitoring Linux - The new agent for Linux in detail (MRPE section)


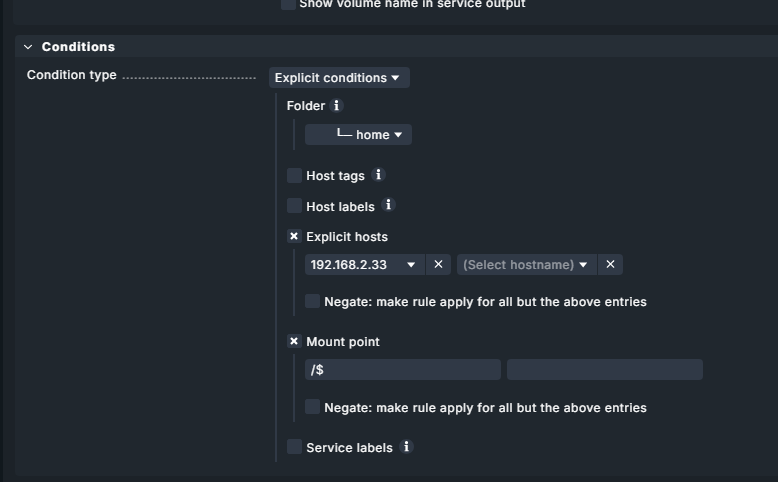
3. “Integrate Nagios plugins” Ruleset — plugins executed on the Checkmk SERVER (recommended for your NetApp case)

This is the most powerful option for your use case. The plugin runs on the Checkmk server itself — not on the agent host — and you configure it once as a rule that applies to multiple hosts automatically.

Setup:

  1. Copy the plugin to ~/local/lib/nagios/plugins/ on your Checkmk server
  2. Make it executable
  3. Navigate to Setup > Services > Other services > Integrate Nagios plugins
  4. Create a rule with the command line, using Checkmk macros:
/path/to/check_netapp_rest -H $HOSTADDRESS$ -w 80 -c 90

Available macros include $HOSTNAME$, $HOSTADDRESS$ and others listed in the inline help of the rule.

This single rule can apply to an entire host folder or host tag group — so one rule covers all your NetApp systems. No per-host configuration needed.

Note: Active checks behave differently from passive services — they always execute on the Checkmk server, even if the monitored host is DOWN, and they are NOT added via service discovery but generated automatically.

Source: Monitoring network services (Active checks) - Monitoring of HTTPS, TCP, SSH, FTP and further services


Decision summary

Situation Solution
Simple script, self-contained logic, no arguments Local Check
Nagios plugin runs on monitored host, checks a nearby resource (end-to-end) MRPE in mrpe.cfg
Nagios plugin connects to network device from Checkmk server “Integrate Nagios plugins” ruleset

For check_netapp_rest reaching your NetApp filers from your Checkmk server: Option 3 is the right approach. One rule, all NetApp hosts covered via $HOSTADDRESS$.

For background on all extension options in Checkmk (and why Checkmk recommends against MRPE/Nagios plugins for new developments): Developing extensions for Checkmk

Hope this points you in the right direction!

as hint:
Netapp E-Series Checks - Checkmk Exchange

perhaps @aeckstein can give more info`s

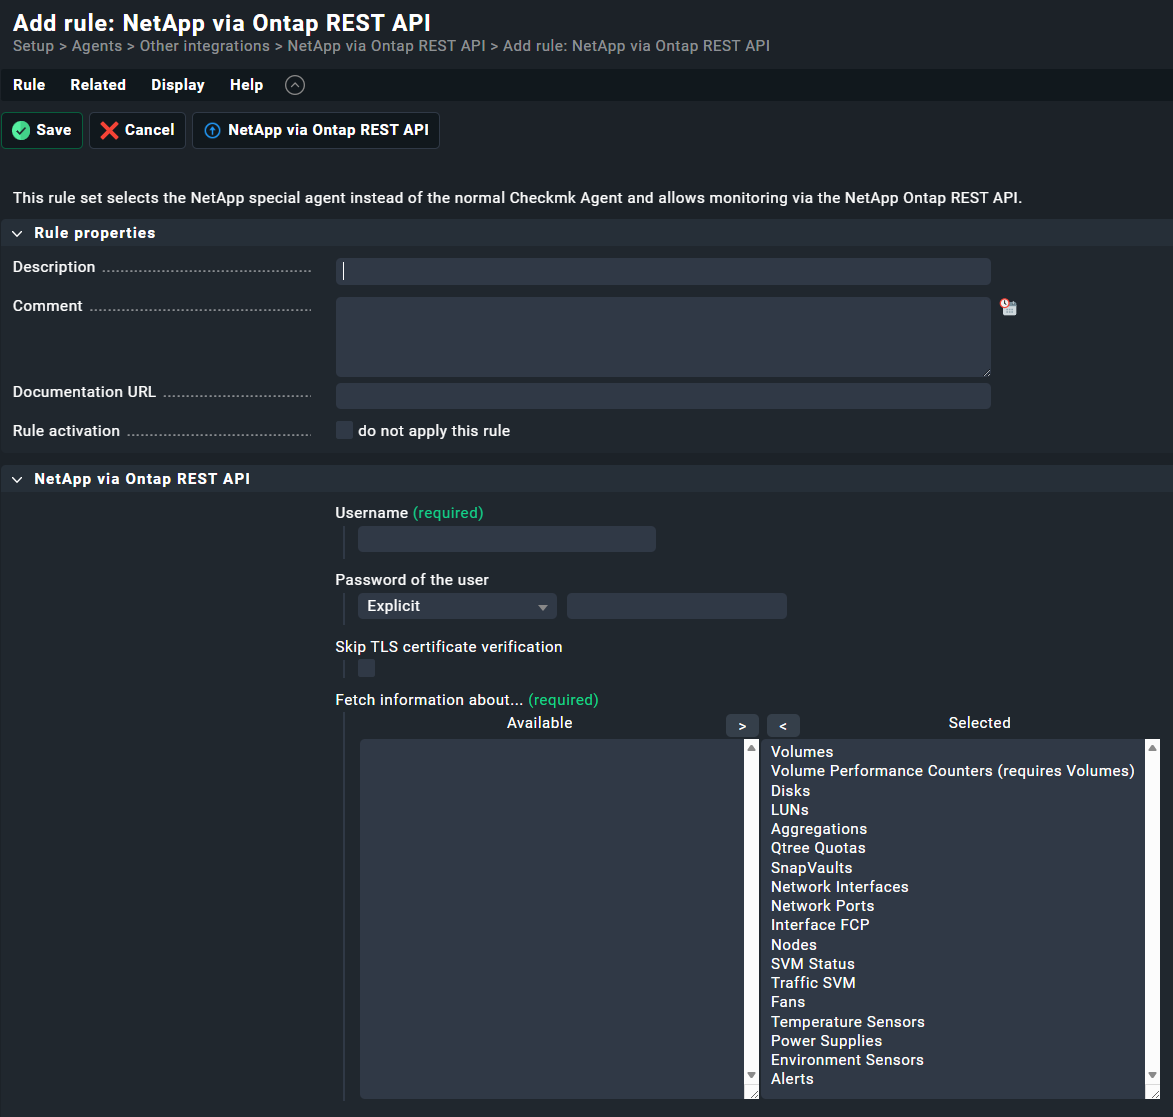
for me the build in works:

1 Like

One more thing worth mentioning regarding your NetApp checks specifically:

Checkmk actually has a built-in NetApp special agent (agent_netapp_ontap) that connects directly to the ONTAP REST API — no Nagios plugin, no MRPE, no active check rule needed. It was fully migrated to the REST API in Checkmk 2.2.0p21 / 2.3.0 (Werk #16324: Werk #16324: NetApp: addition of datasource program and check plugins for NetApp ONTAP).

You set it up under Setup > Agents > Other integrations > NetApp via Ontap REST API and it automatically discovers and monitors:

  • Aggregates (space, trend calculation and fill forecast)
  • Volumes (space, health, snapshots)
  • Disks, LUNs
  • Network interfaces
  • Environment sensors (temperature, voltage, current, fans, PSUs)
  • Node CPUs, SVM traffic & status, MetroCluster, NVRAM Battery

Sources: https://checkmk.com/integrations/netapp_ontap_aggr and Special agents - Monitoring devices via API


So why might you still prefer check_netapp_rest?

The commercial plugin from monitoring-plugins.pro does offer capabilities beyond the builtin:

  • More granular subcommands per check (e.g. aggregate usage, aggregate free, aggregate inodes used/free separately)
  • Regex-based include/exclude filters on every check for very fine-grained control
  • Aggregated/sum mode for volume groups (useful if you monitor by department or naming convention)
  • Checks not in the Checkmk builtin: check_netapp_ems (EMS event messages), SnapCenter backup status, Node service-processor, disk stats (IOps, throughput per disk path)
  • More flexible threshold syntax (absolute, relative, lower+upper combined)

For your use case it is therefore worth evaluating whether the builtin special agent already covers your requirements — it likely covers the majority. The external plugin makes sense on top if you specifically need EMS event monitoring, regex filtering, or the more detailed per-disk metrics.

If you do go the check_netapp_rest route, the “Integrate Nagios plugins” ruleset as described above is exactly the right way to integrate it into Checkmk — one rule per check type, $HOSTADDRESS$ as the host parameter, applied to your NetApp host folder.

Or extend the build-in agent to your missing features :man_lifting_weights:

Hi Bernd,

Thank you very much for the rapid repond. I was just about to loose all hope :slight_smile:

I will look into the last option you mentioned as it will work the best with our current setup.

About the commercial NetApp plugin that we use, I think we will continue using it, because it has a lot other features which the Check_MK version does not. Also it takes care of larger installations, where it doesn’t pull all data at once, and only pull latest data periodically… which makes sense in larger NetApp installations with lots of volumes and lots of snapshots on those volumes… we have tried other checks where it simply used too many recources pulling many thousand snapshot details every five minutes :slight_smile:

We are a bit special, so we look into little specifics which are important to a system. One example would be things like the time a snapmirror update takes, how much data was transfered… and maybe only for specific snapshot names etc. etc. I will have a look at the check_mk plugin, but it would be faster for us to just more of less copy over our existing check options, which we know works… (been working with this for about 8 years now) :wink:

Anyway, thank you again, I will look into this the next few days…

/B

1 Like

just as a hint:

Netapp via Ontap Rest API fails for certain APIs on ASA-A30 9.18.1 - Troubleshooting - Checkmk Forum

I don`t know what kind of Netapp are in your enviroment …

Just had a look, and we actually have a few ASA models which we monitor without any problems with the paid version of the checks. But I am not sure if you are aware, there are actually two versions of the ASA… the first version which is more like a normal AFF/FAS system, and then the ASA R2 versions which we simply avoid selling because they cannot do snapmirror to AFF/FAS systems…
I can also report that the Lenovo DM systems (which is also just a Lenovo branded ONTAP) works without any problems…

1 Like

OK I got it to work with the option 3 approach you mentioned. But I can already for see a lot of work… the way we could set it up, would be to create a host folder, and then attach the checks… So lets say we setup a simple usage check… we have to add the warn and crit values in the rule we setup… so it will be applied to all hosts in the folder… but not all hosts may not need the same limits applied… and the only fix for this it to create a specific rule for each host I guess? And I can forsee this becomming a mess over time to manage… this is managed a bit better in the Thruk GUI… Although I know that it all ends up in a series of checks in the nagios configuration anyway, but still it’s easier to mange and understand (or maybe it’s just because we have used to for so long now?) Or maybe I have overseen some other solution to this? Basically most of the checks are pretty static in nature, but things like space usage and checks of number of snapshots… exclusion of specific network ports etc. etc. this is all specific to one system… This may be way easier to manage by using your NetApp checks, but you sadly do not have the specific checks we need… If there were some kind of “overrule” feature where you were able to change the default rule for each special case? I haven’t looked for this, but I hope there is something similar? :slight_smile:

Hi Heino,

glad you got Option 3 working! And yes — what you’re looking for absolutely exists. This is actually one of Checkmk’s core strengths compared to plain Nagios/Thruk.

The “override” mechanism: Rule stacking with specific conditions

Checkmk’s rule system works with “first match wins” logic, and you can make rules as specific or as broad as you like. So the pattern for your use case is:

  1. Broad rule — applies to the whole folder, sets your standard thresholds (e.g. -w 80 -c 90 for all NetApp hosts)
  2. Specific rule above it — applies only to a single host (or a host tag), sets the exception thresholds (e.g. -w 60 -c 75 for netapp-prod-01 specifically)

Since the specific rule sits higher in the list and matches first, it wins for that host. All other hosts fall through to the broad rule.

To limit a rule to a specific host, use the “Conditions” section of the rule:

  • Explicit hosts → enter the hostname directly
  • or use Host tags / Host labels to group hosts with similar requirements

This way you end up with e.g.:

  • 1 broad rule for standard thresholds
  • 3-4 exception rules for the hosts that need different limits

That scales much better than one rule per host.

For the “Integrate Nagios plugins” ruleset specifically, you can parametrize the command line differently per rule. So your rules might look like:

Rule 1 (host: netapp-prod-01):  check_netapp_rest -H $HOSTADDRESS$ -w 60 -c 75 --check aggregate
Rule 2 (folder: /NetApp):       check_netapp_rest -H $HOSTADDRESS$ -w 80 -c 90 --check aggregate

Rule 1 fires for netapp-prod-01, Rule 2 fires for everything else in the folder.

This is documented in detail here:

Once you get used to the rule stacking concept, it’s actually more maintainable than per-host config in Thruk — because you can see all exceptions in one place and understand why a specific host gets specific thresholds.

Greetz Bernd

Hi again Bernd

Thank you for taking your time to help out a novice :wink:

I had some time to look at these rules… and yes they seem to work OK to some extend.. I have also been looking at CheckMK’s ONTAP checks.. and I am trying to setup a test against one of our storage systems… It finds it OK and creates some checks…

I still find it strange that I cannot just click on the specific service I want to change, and create a service-rule (maybe it’s just me), but I have to go into Setup → Service Monitoring Rules and then try to find it in there… and to be honnest I am struggling to find some of them…

It I just search for netapp I get 7 categories or checks or services… (confusing).. some of them makes sense like the one about volumes etc.. but I am missing a way to disable checks of network interfaces which are not in use, which CheckMK for some reason flags as an error, even though they are disabled on the storage system. I guess I will need to remove those services in order to get rid of them?

Another thing is that you typically have some boot/root aggregates on a NetApp (aggr0) which are small and doesn’t grow, yet CheckMK flags them as low in space… and I am yet to find a way to create a rule that covers the aggregates?

Then there is the service names of interfaces/ports in both the netapp and on cisco switches… they are just named “interface xx” is this because there cannot be service name overlaps overall? so if you name it eth0 on host 1 you cannot have an eth0 on host2 ?

/B

Hi Heino,

sorry for the late replies

Don’t worry, the transition from “clicking a service” to “finding the right rule” is the steepest part of the Checkmk learning curve. Once you get the logic, it becomes very powerful. Here are some insights to help you navigate this:

1. The “Shortcut” to Rule Creation

You mentioned it’s tedious to go through Setup -> Service Monitoring Rules. There is a much faster way!

  • The Magic Button: Go to the host’s service list. Next to the service (e.g., your NetApp aggregate), click the three-line menu (hamburger icon) or the “Parameters for this service” three-line menu (hamburger icon).
  • This will take you to a page showing every rule currently affecting this specific service. From there, you can click directly on the rule type you need to create a new one for that service.
  • See: Checkmk Documentation - Rules

and then easy edit all options also with regex

2. Handling “Down” Network Interfaces

Checkmk warns about unused interfaces because it doesn’t know if they are “supposed” to be down or if a cable was accidentally unplugged.

  • The Rule: Search for “Network interface and switch port discovery”.
  • The Fix: In this rule, you can define which interfaces should be monitored based on their state or description. You can set it to “Ignore operational status” or “Monitor only interfaces that are up”.
  • Alternatively, use the “Disabled services” rule to manually hide specific “Interface xxx” services you don’t care about.

3. Tuning Aggregate Thresholds (aggr0)

For those small NetApp boot aggregates, you don’t want the global 80%/90% thresholds.

  • The Rule: Search for “Filesystems (used space and growth)”.
  • Pro Tip: Create a new rule. In the “Service selection” part of the rule, enter Aggregate aggr0 (or a regex like Aggregate aggr.*). Then, set the levels to “95% / 99%” or even “Do not monitor” if you prefer.
  • See: Checkmk - Monitoring Filesystems

4. Service Names (Interface xx)

Your suspicion about name overlaps is a common myth! Checkmk can have “eth0” on 1.000 different hosts. The Service Name only needs to be unique per host.

  • Why “Interface 01”? By default, Checkmk uses the index (ID) because names/descriptions can change or be empty.
  • The Fix: Go back to the “Network interface and switch port discovery” rule. Under “Appearance of interfaces”, change the setting to “Use description” or “Use alias”. This will turn “Interface 01” into “e0a” or “Management Port”.
  • Note: Changing this will “remove” the old services and “find” new ones, so you’ll need to do a “Fix all” in the service configuration.

Summary for your search:

  • Aggregates/Volumes: Use “Filesystems” rules.
  • Interfaces: Use “Network interface and switch port discovery”.
  • Excluding things: Use “Disabled services”.

It takes a moment to click, but once you have your “NetApp Base Rules” defined, adding the next 10 storage systems will take only seconds!

Greetz Bernd