Hello,
I’ve been trying to use the “report” feature of CheckMK lately but with mitigated success.
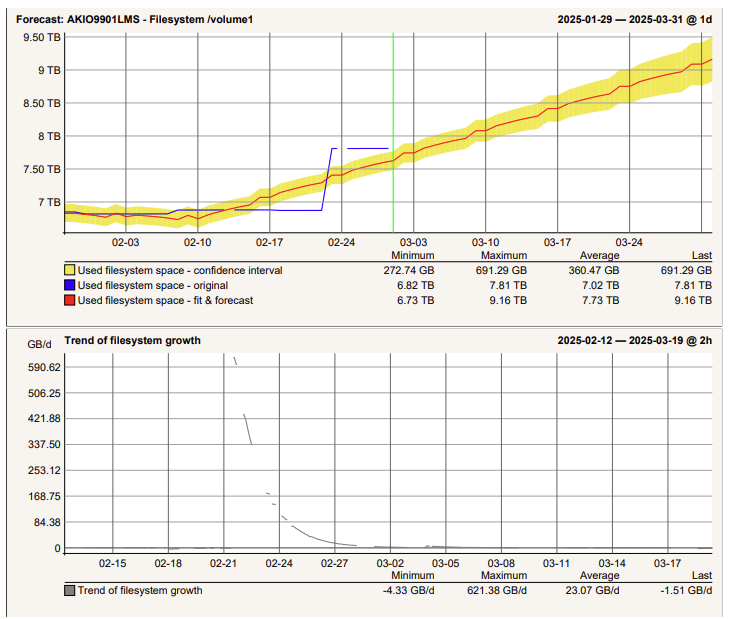
I’ve managed to create a report showing both a graph showing the volumetric evolution of a host and another graph showing what is written on it for the last 30 days:
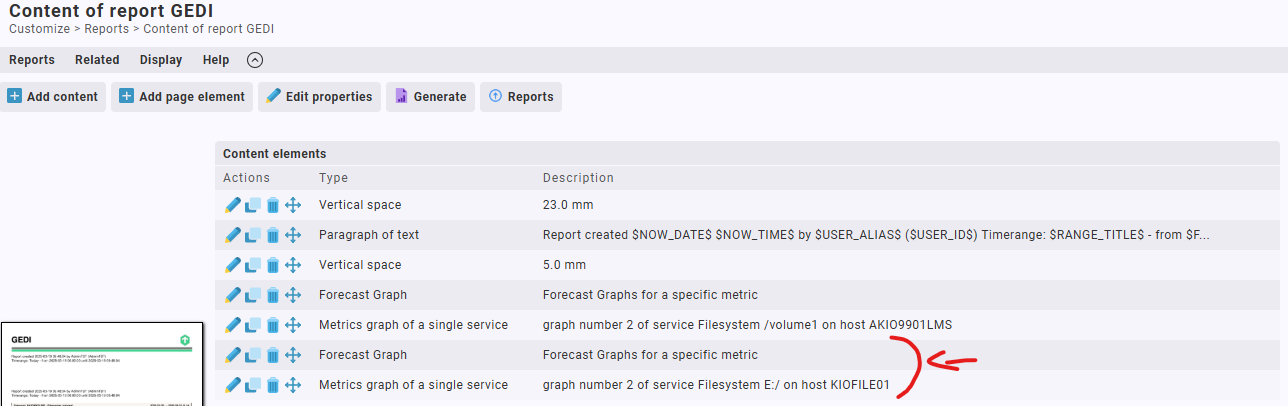
But, i would like to have on top of my report a table showing the storage used (now, 7 days ago and 30 days ago for eg) on every service that i’ve put into a service group.
I don’t have any clue on how to do that. The tutorial on the checkmk site is complicated and i think i would gain a lot of time if someone clearly explained it to me.
There is only a “service availability” table built in which is not near what i would want.
Thanks in advance