I don’t think that’s currently possible with the plugin. A workaround may be to create a ping check as a service using the “Check hosts with PING (ICMP Echo Request)” rule - unfortunately this would have the effect of doubling ping traffic to the host unless you turned off ping checking at the host level.
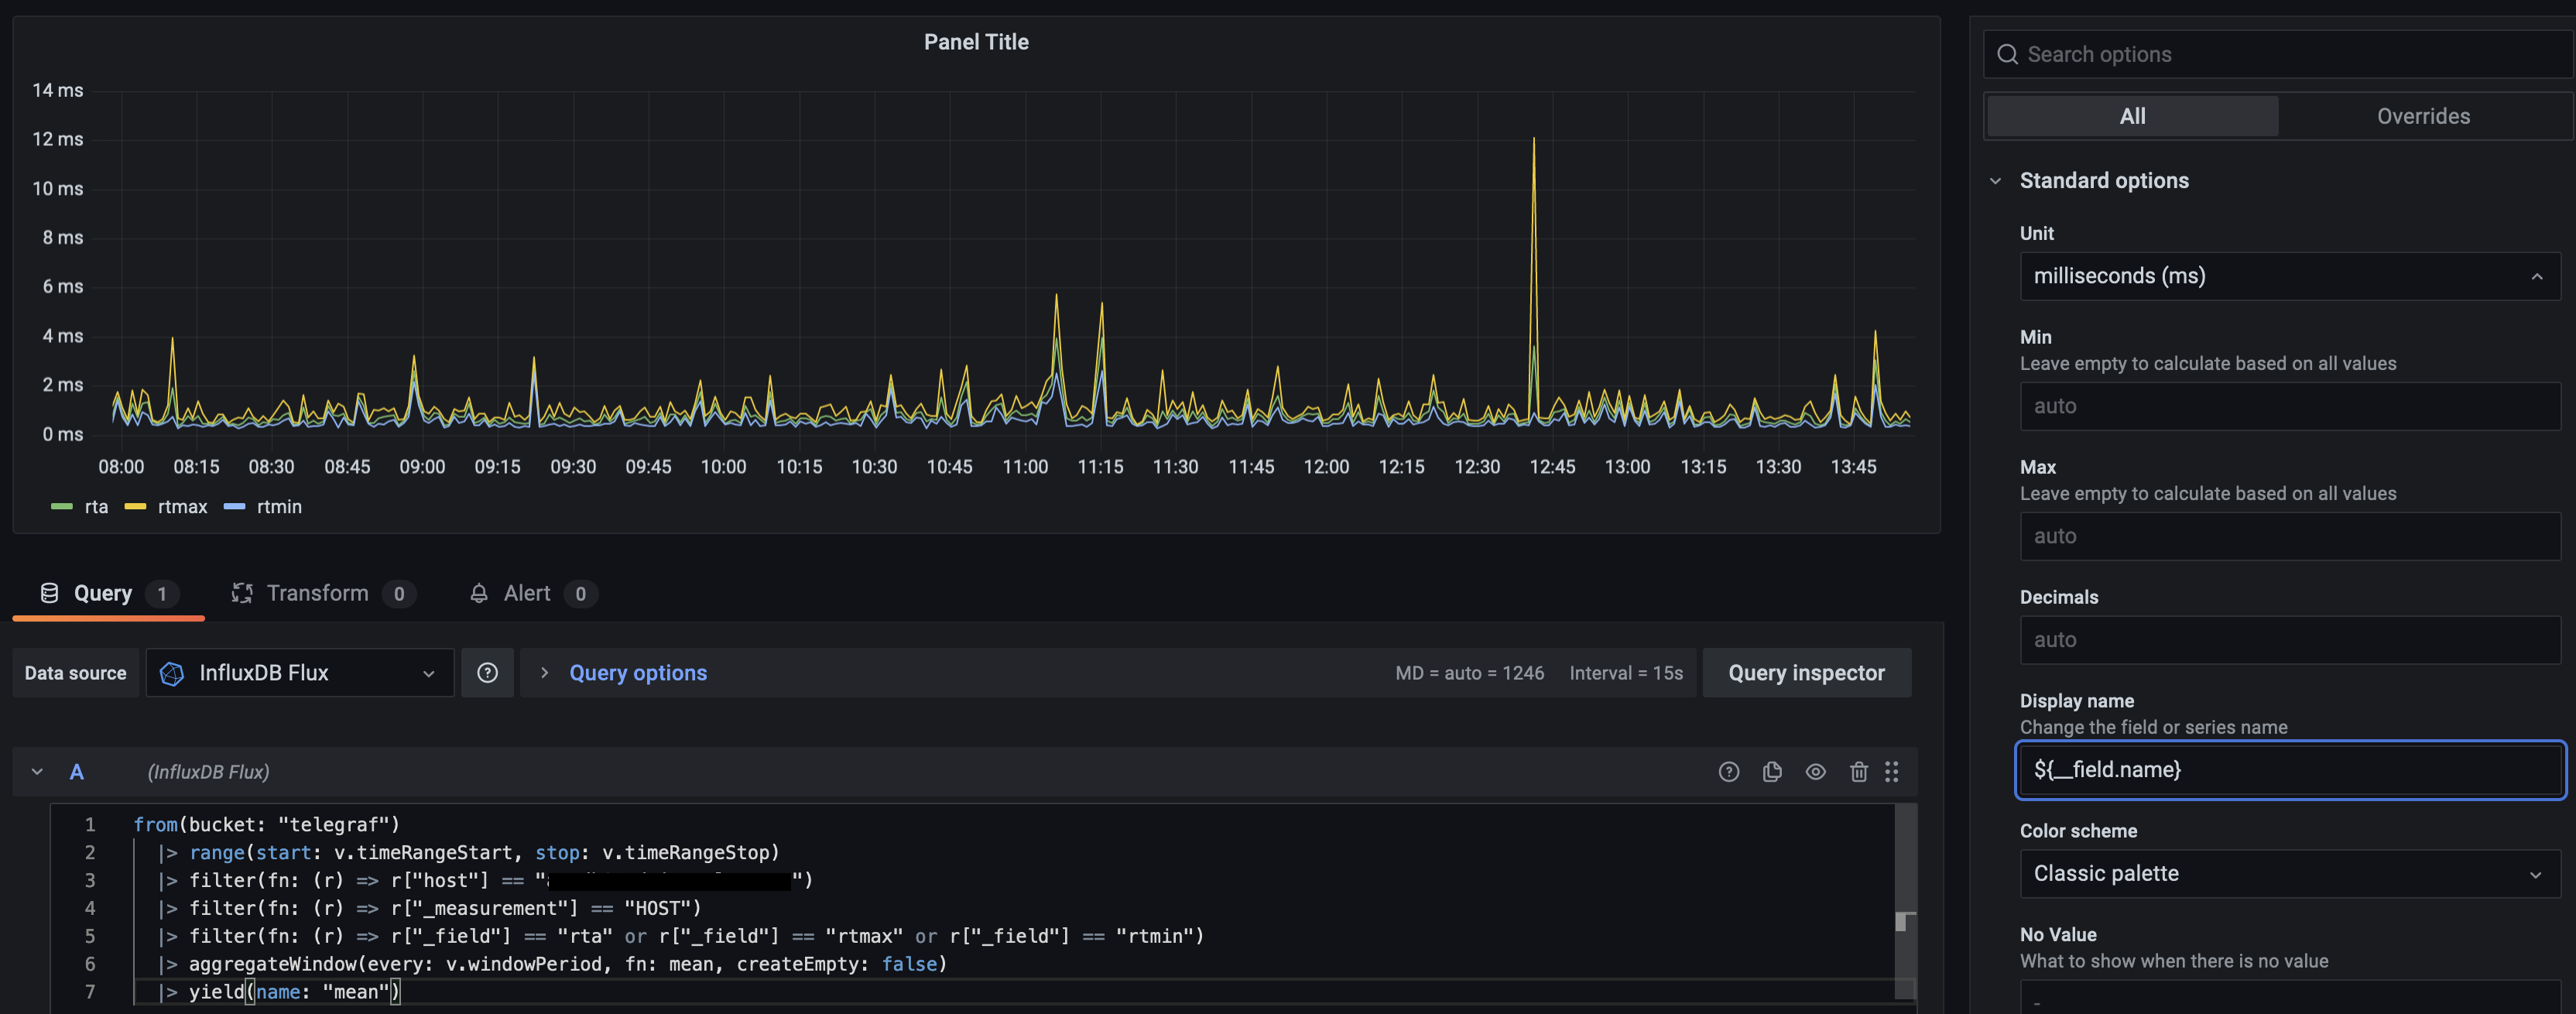
We do things the other way around and have Check MK send metrics to an InfluxDB instance which Grafana then queries. Check MK does then actually export the host ping metrics as well, like this:
This topic was automatically closed 365 days after the last reply. New replies are no longer allowed. Contact an admin if you think this should be re-opened.