The Java Management Extensions (JMX) framework was introduced in Java 1.5 and has found widespread acceptance in the Java developers community since its inception.
It provides an easily configurable, scalable, reliable and more or less friendly infrastructure for managing Java application either locally or remotely. The framework introduces the concept of MBeans for real-time management of applications.
JMX Architecture
JMX architecture follows a three-layered approach:
Instrumentation layer: MBeans registered with the JMX agent through which resources are managed
JMX agent layer: the core component (MbeanServer) which maintains registry of managed MBeans and provides an interface to access them
Remote management layer: usually client side tool like JConsole
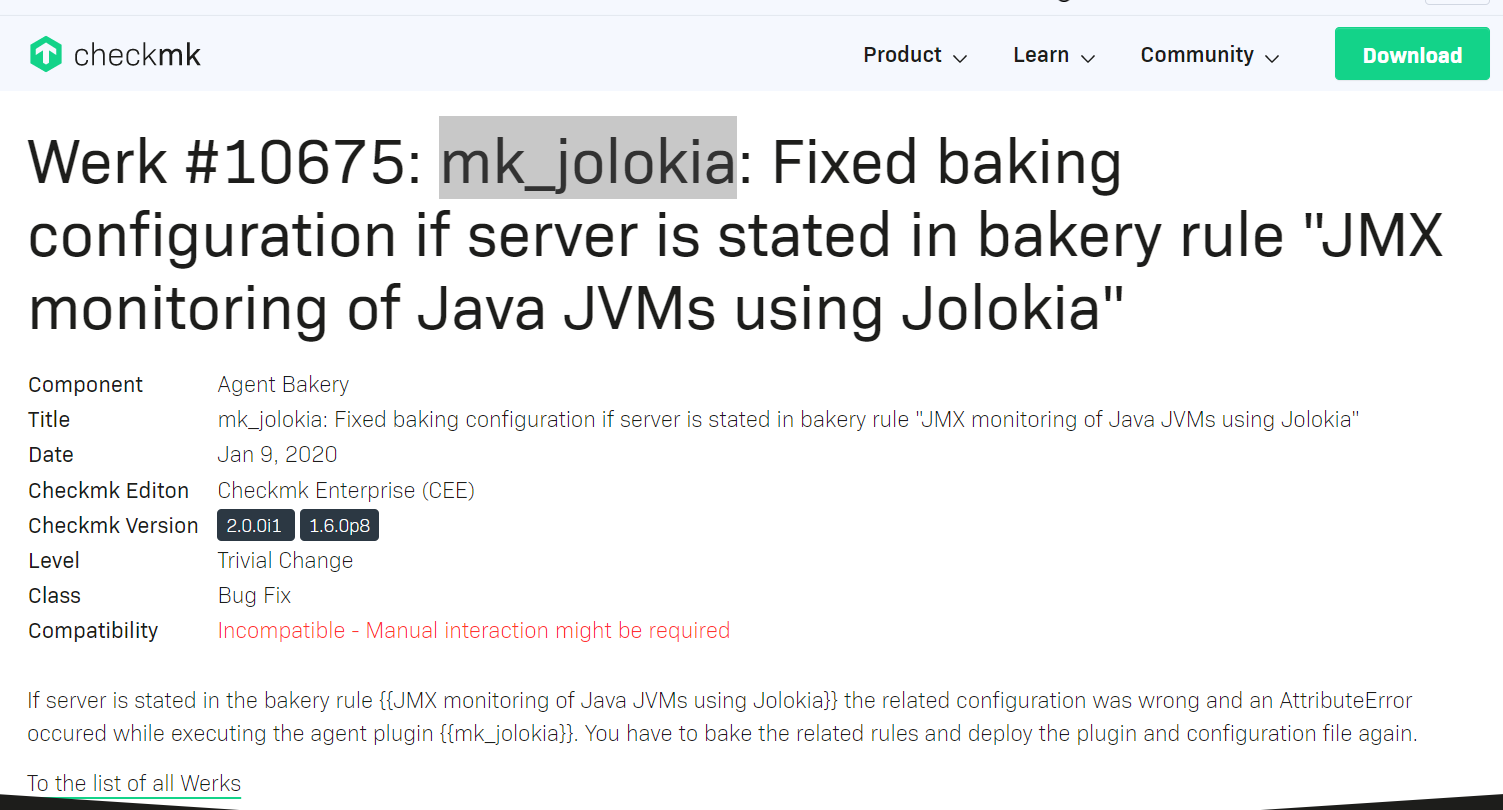
Configuration
If you want to monitor JMX you need two additional files on the client:
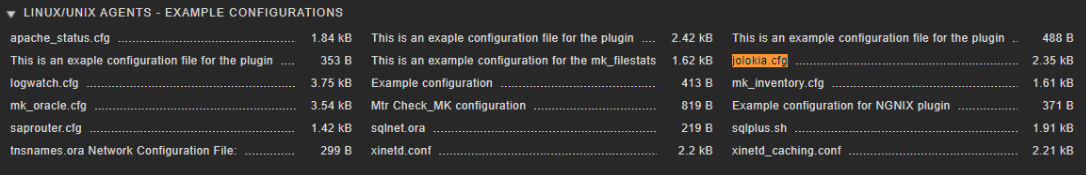
jolokia.cfg in /etc/check_mk
and
mk_jolokia.py plugin in /usr/lib/check_mk_agent/plugins.
You can find both files in Monitoring Agents section of check_mk server:
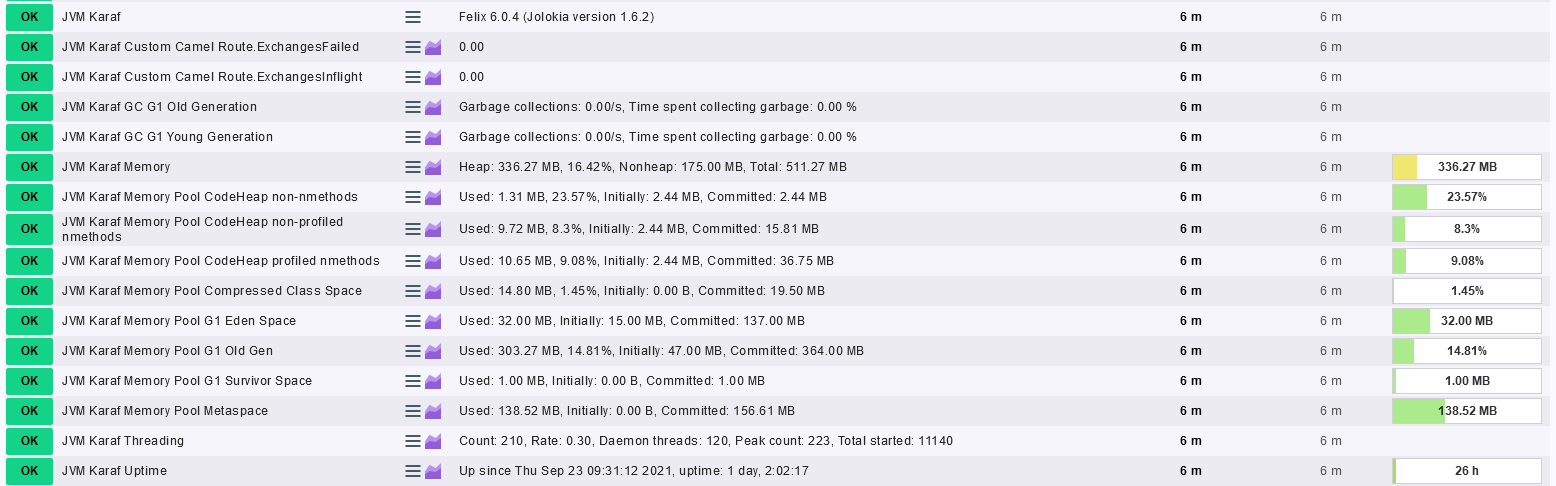
Remember you need Jolokia activated on the Java process you are trying to monitor.
They are couple of ways to activate jolokia. We need to know how your java application is running. Standalone or inside application server.
Various agents are available for providing Jolokia services in different environments:
WAR Agent: for deployment as web application in a Java EE Server.
OSGi Agent: for deployment in an OSGi container. This agent is packaged as a bundle and comes in two flavors (minimal, all-in-one).
JVM Agent: which can be used with any Oracle/Sun based JVM, Version 6 or later.
Mule Agent: for usage within a Mule ESB.
More Info here: Jolokia – Agents