Today I have upgraded to ILO 5 3.06 version.facing same disks loading issur
1 Like
Hi, while we haven’t heard back from HPE yet, we changed the fan check so that it no longer crashes. Instead, it shows a warning informing about the uncertainty regarding the reported value. The status computation is not affected by this change as it is based on a different OID.
Please also see Werk #17186.
1 Like
We have downgraded all our ILOs to “iLO 5 - 3.03” because every newer version has another Problem/Error. That version works fine :).
Josef
Upgraded iLO to 3.07 and CheckMK to 2.3.0p12 and fans seems to be working, speed returned in %. Thank you!
IlO 3.06 - “Support for Fan speed in terms of percentage from SNMP OID Get and Walk.”
HPE iLO Firmware Version 3.07 is out:
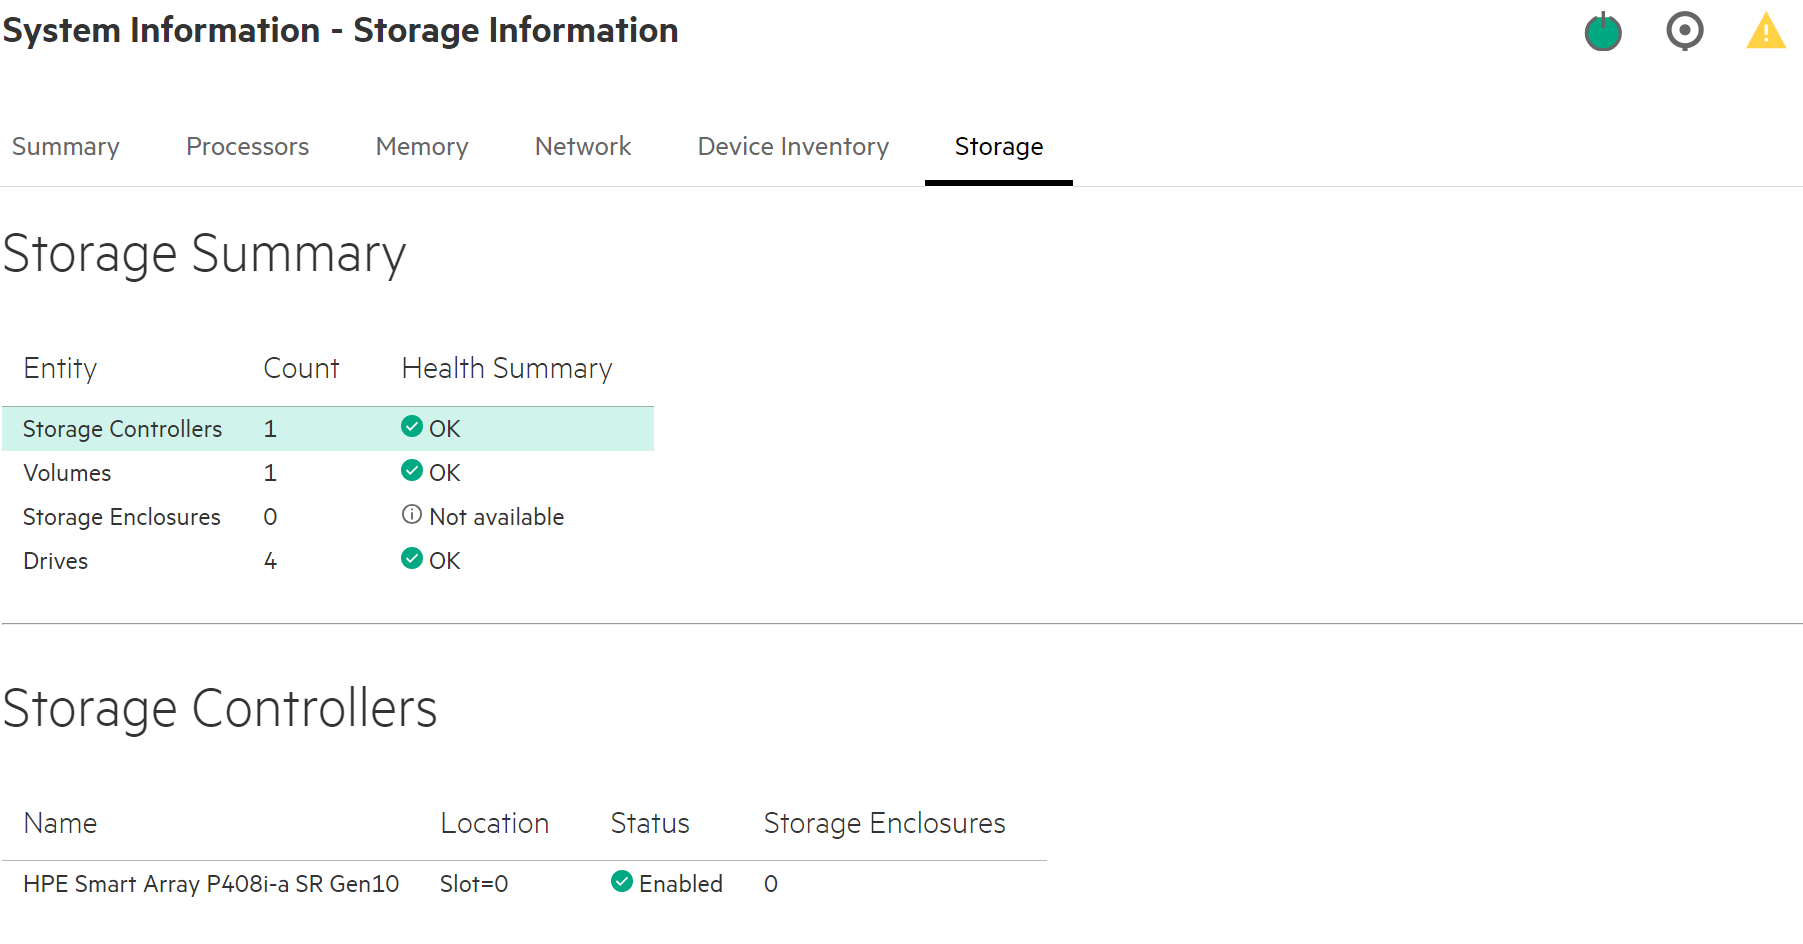
I still have the problem with ILO5 3.07 that my storage health is shown as degraded but no warning/error is shown on storage page in ILO.
My HPE case is not open for several months, they seem to have 0 clue what is going on. They recommended updating controler firmware to version 6.52B, I did this. They wanted me to redo this now multiple times. Sometimes the error is gone after a firmware update of ILO of controller, or host restart. But only a couple of days.
I didn’t used checkmk redfish plugin until today, but I installed it to see what the output is there. Any ideas? Same issue as all other have here?
Checkmk version 2.1.0p44
Try license usage history update.
Trying to acquire lock on /omd/sites/backup_team/var/check_mk/license_usage/next_run
Got lock on /omd/sites/backup_team/var/check_mk/license_usage/next_run
Trying to acquire lock on /omd/sites/backup_team/var/check_mk/license_usage/history.json
Got lock on /omd/sites/backup_team/var/check_mk/license_usage/history.json
Next run time has not been reached yet. Abort.
Releasing lock on /omd/sites/backup_team/var/check_mk/license_usage/history.json
Released lock on /omd/sites/backup_team/var/check_mk/license_usage/history.json
Releasing lock on /omd/sites/backup_team/var/check_mk/license_usage/next_run
Released lock on /omd/sites/backup_team/var/check_mk/license_usage/next_run
+ FETCHING DATA
Source: SourceType.HOST/FetcherType.PROGRAM
[cpu_tracking] Start [7f2ba825d4c0]
[ProgramFetcher] Fetch with cache settings: DefaultAgentFileCache(xxxxx, base_path=/omd/sites/backup_team/tmp/check_mk/data_source_cache/special_redfish, max_age=MaxAge(checking=0, discovery=90, inventory=90), disabled=False, use_outdated=False, simulation=False)
Not using cache (Too old. Age is 51 sec, allowed is 0 sec)
[ProgramFetcher] Execute data source
Calling: /omd/sites/backup_team/local/share/check_mk/agents/special/agent_redfish '-u' 'xxxxxx' '-s' 'xxxxx' '-p' '443' '-P' 'https' '-m' 'Memory,Power,Processors,Thermal,FirmwareInventory,NetworkAdapters,NetworkInterfaces,EthernetInterfaces,Storage,ArrayControllers,SmartStorage,HostBusAdapters,PhysicalDrives,LogicalDrives' '172.16.89.14'
Write data to cache file /omd/sites/backup_team/tmp/check_mk/data_source_cache/special_redfish/xxxxxx
Trying to acquire lock on /omd/sites/backup_team/tmp/check_mk/data_source_cache/special_redfish/xxxxxx
Got lock on /omd/sites/backup_team/tmp/check_mk/data_source_cache/special_redfish/xxxxxx
Releasing lock on /omd/sites/backup_team/tmp/check_mk/data_source_cache/special_redfish/xxxxxx
Released lock on /omd/sites/backup_team/tmp/check_mk/data_source_cache/special_redfish/xxxxxx
[cpu_tracking] Stop [7f2ba825d4c0 - Snapshot(process=posix.times_result(user=0.010000000000000009, system=0.0, children_user=0.35, children_system=0.04, elapsed=14.530000001192093))]
Source: SourceType.HOST/FetcherType.PIGGYBACK
[cpu_tracking] Start [7f2ba825d6a0]
[PiggybackFetcher] Fetch with cache settings: NoCache(xxxxxx, base_path=/omd/sites/backup_team/tmp/check_mk/data_source_cache/piggyback, max_age=MaxAge(checking=0, discovery=90, inventory=90), disabled=True, use_outdated=False, simulation=False)
Not using cache (Cache usage disabled)
[PiggybackFetcher] Execute data source
No piggyback files for 'xxxxxx'. Skip processing.
No piggyback files for '172.16.89.14'. Skip processing.
Not using cache (Cache usage disabled)
[cpu_tracking] Stop [7f2ba825d6a0 - Snapshot(process=posix.times_result(user=0.0, system=0.0, children_user=0.0, children_system=0.0, elapsed=0.0))]
+ PARSE FETCHER RESULTS
Source: SourceType.HOST/FetcherType.PROGRAM
<<<check_mk:sep(32)>>> / Transition NOOPParser -> HostSectionParser
<<<redfish_manager:sep(0)>>> / Transition HostSectionParser -> HostSectionParser
<<<redfish_system:sep(0)>>> / Transition HostSectionParser -> HostSectionParser
<<<redfish_processors:sep(0)>>> / Transition HostSectionParser -> HostSectionParser
<<<redfish_networkinterfaces:sep(0)>>> / Transition HostSectionParser -> HostSectionParser
<<<redfish_memory:sep(0)>>> / Transition HostSectionParser -> HostSectionParser
<<<redfish_ethernetinterfaces:sep(0)>>> / Transition HostSectionParser -> HostSectionParser
<<<redfish_arraycontrollers:sep(0)>>> / Transition HostSectionParser -> HostSectionParser
<<<redfish_physicaldrives:sep(0)>>> / Transition HostSectionParser -> HostSectionParser
<<<redfish_logicaldrives:sep(0)>>> / Transition HostSectionParser -> HostSectionParser
<<<redfish_networkadapters:sep(0)>>> / Transition HostSectionParser -> HostSectionParser
<<<redfish_ethernetinterfaces:sep(0)>>> / Transition HostSectionParser -> HostSectionParser
<<<redfish_chassis:sep(0)>>> / Transition HostSectionParser -> HostSectionParser
<<<redfish_networkadapters:sep(0)>>> / Transition HostSectionParser -> HostSectionParser
<<<redfish_power:sep(0)>>> / Transition HostSectionParser -> HostSectionParser
<<<redfish_thermal:sep(0)>>> / Transition HostSectionParser -> HostSectionParser
No persisted sections
-> Add sections: ['check_mk', 'redfish_arraycontrollers', 'redfish_chassis', 'redfish_ethernetinterfaces', 'redfish_logicaldrives', 'redfish_manager', 'redfish_memory', 'redfish_networkadapters', 'redfish_networkinterfaces', 'redfish_physicaldrives', 'redfish_power', 'redfish_processors', 'redfish_system', 'redfish_thermal']
Source: SourceType.HOST/FetcherType.PIGGYBACK
No persisted sections
-> Add sections: []
Received no piggyback data
Received no piggyback data
[cpu_tracking] Start [7f2ba827e370]
value store: synchronizing
Trying to acquire lock on /omd/sites/backup_team/tmp/check_mk/counters/xxxxxx
Got lock on /omd/sites/backup_team/tmp/check_mk/counters/xxxxxx
value store: loading from disk
Releasing lock on /omd/sites/backup_team/tmp/check_mk/counters/xxxxxx
Released lock on /omd/sites/backup_team/tmp/check_mk/counters/xxxxxx
CPU 1 Type: CPU, Model: Intel(R) Xeon(R) Silver 4110 CPU @ 2.10GHz, Cores: 8, Threads: 16, Speed maximum 4000 MHz
Check_MK Agent Version: 2.0, OS: iLO 5 - 3.07
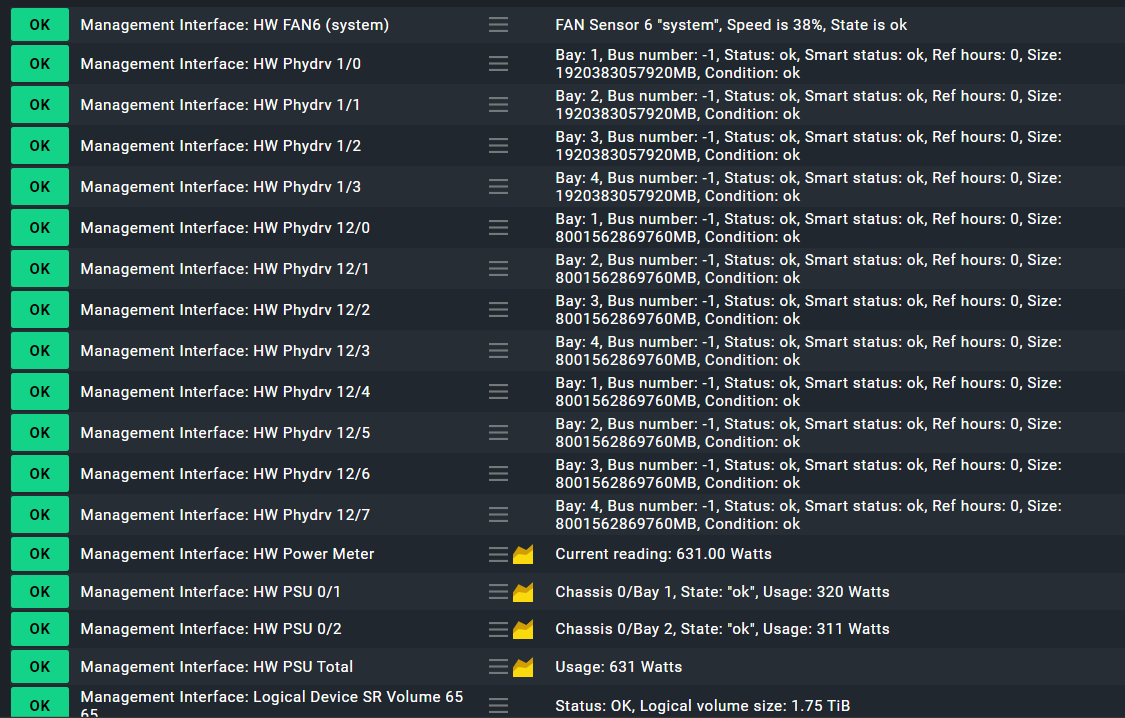
Drive 1I:1:1 Size: 3726GB, Speed 6.0 Gbs
Drive 1I:1:2 Size: 3726GB, Speed 6.0 Gbs
Drive 1I:1:3 Size: 3726GB, Speed 6.0 Gbs
Drive 1I:1:4 Size: 3726GB, Speed 6.0 Gbs
Fan 3 Speed: 12.0%
Fan 4 Speed: 12.0%
Fan 5 Speed: 12.0%
Fan 6 Speed: 12.0%
Fan 7 Speed: 12.0%
Memory Summary Capacity: 32GB, with State: Rollup State: Normal
Memory proc1dimm10 Size: 16GB, Type: DDR4-2400 MultiBitECC
Memory proc1dimm8 Size: 16GB, Type: DDR4-2400 MultiBitECC
Network Adapter 1 Model: HPE Ethernet 1Gb 4-port 331i Adapter - NIC, SeNr: N/A, PartNr: None
Network Adapter 2 Model: HP FlexFabric 10Gb 2-port 533FLR-T Adapter, SeNr: MY59440NS1, PartNr: 701534-001
Network Adapter DC07B000 Model: HPE FlexFabric 10Gb 2P 533FLR-T Adptr, SeNr: MY59440NS1, PartNr:
PSU 0-HpeServerPowerSupply 0.0 Watts input, 55.0 Watts output, 218.0 V input, Capacity 500.0 Watts, Typ 865408-B21
PSU 1-HpeServerPowerSupply 0.0 Watts input, 55.0 Watts output, 219.0 V input, Capacity 500.0 Watts, Typ 865408-B21
Physical port 1 Link: LinkUp, Speed: 1000Mbps, MAC: 08:f1:ea:75:43:a4
Physical port 2 Link: LinkUp, Speed: 1000Mbps, MAC: 08:f1:ea:75:43:a5
Physical port 2125 Link: LinkUp, Speed: 1000Mbps, MAC: 08:f1:ea:df:51:c0
Physical port 2126 Link: LinkUp, Speed: 1000Mbps, MAC: 08:f1:ea:df:51:c4
Physical port 3 Link: Unknown, Speed: 0Mbps, MAC: 08:f1:ea:75:43:a6
Physical port 4 Link: Unknown, Speed: 0Mbps, MAC: 08:f1:ea:75:43:a7
Storage Controller 0 Type: HPE Smart Array P408i-a SR Gen10, Serial: xxxxx
System state System with SerialNr: xxxxx, has State: Component State: A condition requires attention., Rollup State: A condition requires attention., This resource is enabled.
Temp 01-Inlet Ambient Temperature: 25.0°C
Temp 02-CPU 1 Temperature: 47.0°C
Temp 06-P1 DIMM 7-12 Temperature: 44.0°C
Temp 12-HD Max Temperature: 35.0°C
Temp 14-Stor Batt 1 Temperature: 29.0°C
Temp 15-Front Ambient Temperature: 30.0°C
Temp 16-VR P1 Temperature: 43.0°C
Temp 18-VR P1 Mem 1 Temperature: 37.0°C
Temp 19-VR P1 Mem 2 Temperature: 34.0°C
Temp 22-Chipset Temperature: 51.0°C
Temp 23-BMC Temperature: 81.0°C
Temp 24-BMC Zone Temperature: 49.0°C
Temp 25.1-HD Controller-Add-in card Temperature: 41.0°C
Temp 25.2-HD Controller-I/O controlle Temperature: 50.0°C
Temp 25.3-HD Controller-I/O controlle Temperature: 43.0°C
Temp 26-HD Cntlr Zone Temperature: 44.0°C
Temp 27.1-LOM-Communication Channel Temperature: 71.0°C
Temp 28.1-LOM Card-I/O module Temperature: 76.0°C
Temp 28.2-LOM Card-I/O module Temperature: 70.0°C
Temp 29-I/O Zone Temperature: 42.0°C
Temp 31-PCI 1 Zone Temperature: 43.0°C
Temp 33-PCI 2 Zone Temperature: 42.0°C
Temp 38-Battery Zone Temperature: 41.0°C
Temp 39-P/S 1 Inlet Temperature: 33.0°C
Temp 40-P/S 2 Inlet Temperature: 34.0°C
Temp 41-P/S 1 Temperature: 40.0°C
Temp 42-P/S 2 Temperature: 40.0°C
Temp 43-E-Fuse Temperature: 25.0°C
Temp 44-P/S 2 Zone Temperature: 30.0°C
Temp 49-CPU 1 PkgTmp Temperature: 67.0°C
Volume 0:1 Raid Type: RAID5, Size: 11178GB
No piggyback files for 'xxxxxx'. Skip processing.
No piggyback files for '172.16.89.14'. Skip processing.
[cpu_tracking] Stop [7f2ba827e370 - Snapshot(process=posix.times_result(user=0.010000000000000009, system=0.0, children_user=0.0, children_system=0.0, elapsed=0.010000001639127731))]
[special_redfish] Success, execution time 14.5 sec | execution_time=14.540 user_time=0.020 system_time=0.000 children_user_time=0.350 children_system_time=0.040 cmk_time_ds=14.130 cmk_time_agent=0.000
Your output shows no storage health problem.
The only one is this.
Yes, that’s basically my issue for the last months. ILO complains about degraded storage health but it does not show any details anywhere. Even HPE support can’t tell what ILO is complaining about.
What is this rollup state?
For me this did not start with ILO5 3.00, it started with >= 3.01. If I revert to an older version the warning is gone.
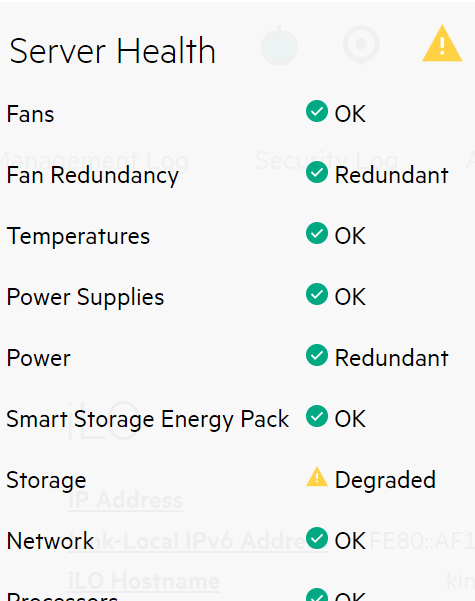
That is the overall state of your system. Like in your screenshot the upper right corner.
If you don’t see anything inside the GUI than also it is very unlikely to get something with the Redfish plugin directly. But you can check the raw agent output if you can find anything there inside.
Not much more information. I guess I’ve to wait for HPE to fix this accidentally at some point.
"AggregateServerHealth": "Warning"
"Storage": {"Status": {"Health": "Warning"}}
"Status": {"Health": "Warning", "HealthRollup": "Warning", "State": "Enabled"}
With the “Redfish Mockup Creator” you can get a complete data dump of your Redfish interface.
Inside this data you can, if you want, search for some insights.
@pirx are you using non-HPE HDDs in your server? ![]()
Thx, created a dump and send it to HPE but I’ve no much hope.
No, we buy directly at HPE and all disks have HPE part numbers and firmware. In this case 4 x 4TB 6G SATA HDD - MB4000GVYZK
This dump is not for HPE - they will not do anything with this. It is only for you to have a look at all the raw data from the management interface.
HPE support checked redfish data in AHS logs before. tbh I don’t know where to start there. But thanks for the advise!
I have installed 3.06 and everything now works for me finally! I see Fans, HW Phydrv and Logical Drive status.
To mitigate the fan issue (see posts above), I have updated to checkmk 2.2p32.
3 Likes
Firmware 3.09 from 10/10/24 still has the same issues unfortunately.
It does indeed have the same issues. Although, we have this setup 10 times, not everything failes. Can it be due to snmp timeout settings? or purely the ilo software?
UNKN
HW Controller 0 Open the action menu Condition: ok, Board-Condition: other, Board-Status: enabled, (Role: other, Model: 1, Slot: 0, Serial: ) 2024-10-30 11:36:04 - 79 m 2024-10-30 12:51:06 - 4 m
UNKN
HW Controller 1 Condition: ok, Board-Condition: other, Board-Status: enabled, (Role: other, Model: 1, Slot: 1, Serial: ) 2024-10-30 11:36:04 - 79 m 2024-10-30 12:51:06 - 4 m
UNKN
HW Controller 2 Condition: ok, Board-Condition: other, Board-Status: enabled, (Role: other, Model: 1, Slot: 2, Serial: ) 2024-10-30 11:36:04 - 79 m 2024-10-30 12:51:06 - 4 m
OK
SNMP Info Integrated Lights-Out 5 3.09 Oct 08 2024,
Although you still connect to the ILO, i’ve installed redfish mkp to have it all working again. Maybe, but the pressure drops towards HPe ofcourse, this can be a work around?
On my infra, redfish works flawlessly (for now)