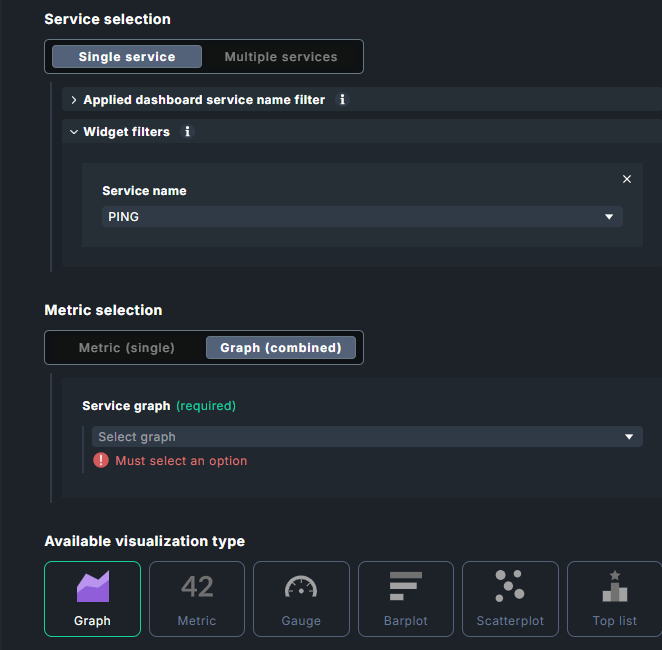
I’m using Community Edition 2.5.0p8 and I want to add a Ping service chart to a dashboard.
It’s strange that “Graph combined” is selected in “Metric selection” instead of “Metric (single)” even though I have the Community Edition. And even when I try to create a chart with this option, none of the dropdown menu options work.
Do you know if this is a version bug or if I’m doing something wrong?
Since you are using the Community Edition, only the built-in service graphs option is available for the graph widget selection.
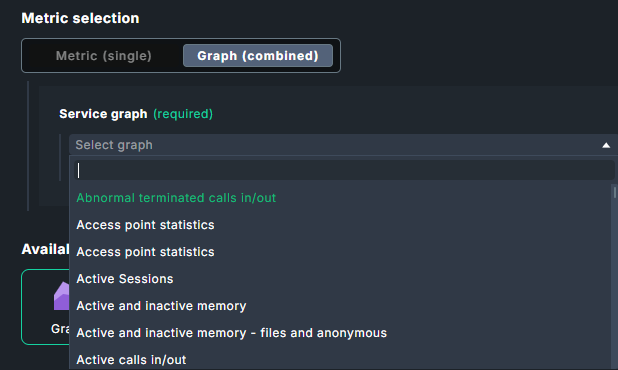
From my understanding, you would like to add one of the built-in service graphs associated with the PING service of a specific host. If that is correct, you should be able to find it by searching for the exact service graph title in the select graph drop-down list when adding the widget to your dashboard.
Thanks for your reply. That’s the strange thing: I’m using the options enabled for the Community version. In the service name field, I type the service exactly as it’s called, “PING,” but when I select the metric, none of the options correspond to PING.
However, if I go directly to the PING service and select “Add to Dashboard” in the graph, it works fine. That’s why I think it must be a bug in the interface.
This is because PING is a service, not a built-in service graph. When adding a graph to your dashboard, you need to select one of the built-in graphs associated with that service.
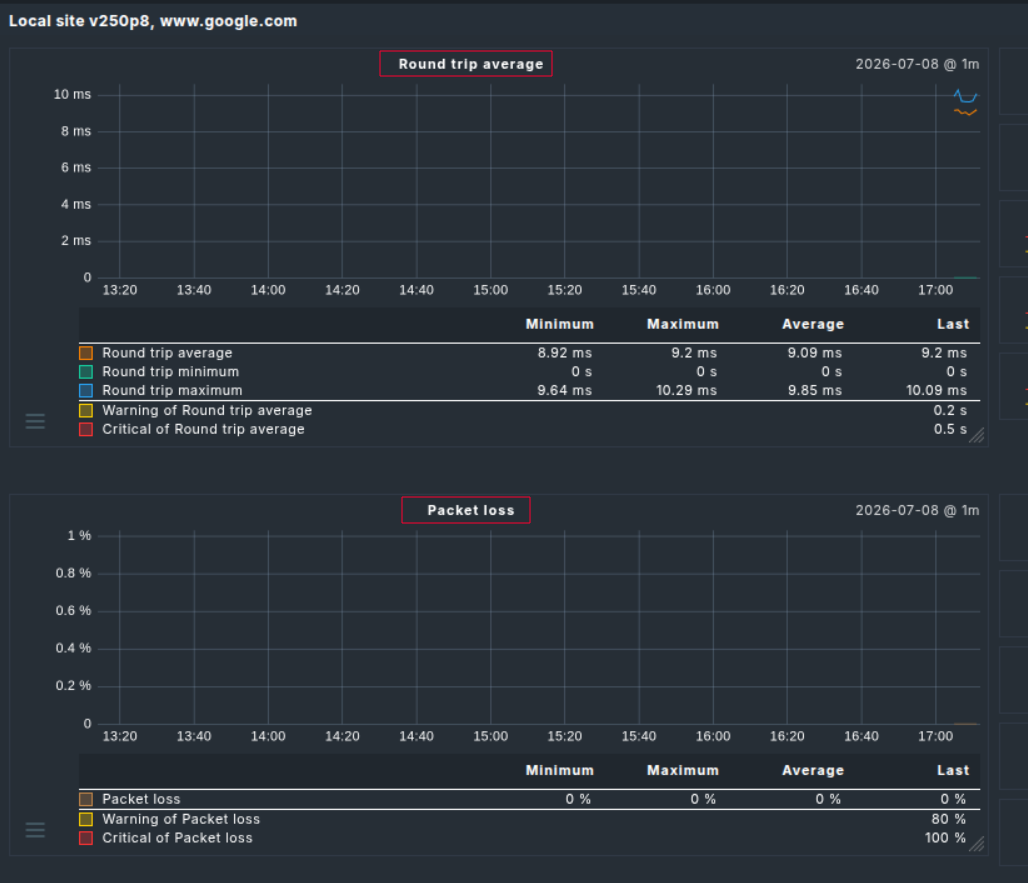
In your case, you are probably looking for either Round trip average or Packet loss, as these are the built-in graphs provided for the PING service.
Fantastic, Mathieu, thank you so much for your explanation. It helped me and I’ve solved the problem. Thank you for your patience and for taking the time to help me.